Fig. 2
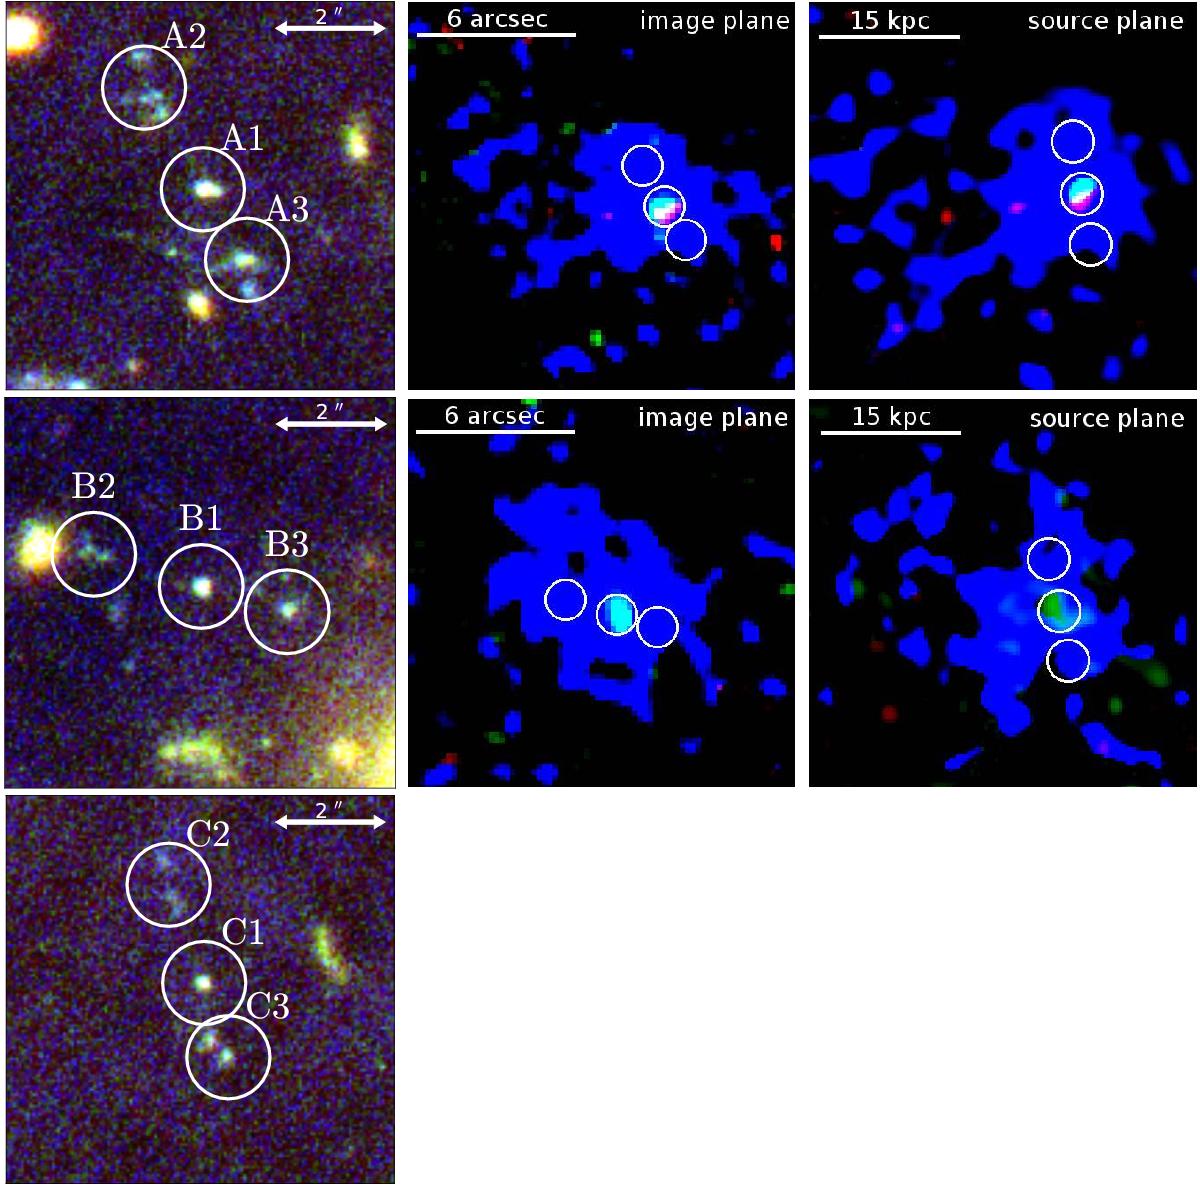
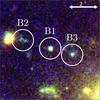
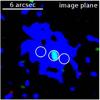
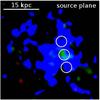
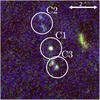
Left panels: details of the LAB multiple images in the HFF colour composite image using the HST/ACS F435W, F606W and F814W filters. The circles have ![]() radius showing the compact source in the centre (ID 1) and the filamentary substructure (IDs 2 and 3). Central panels: colour composite images using the Lyα, C iv and He ii emissions (blue, green and red channels, respectively) of the two LAB in the MUSE footprint, with a smooth kernel of 1″. Right panels: projected emissions onto the source plane. Note that the multiple images C are outside of our MUSE observations, and therefore we cannot show the corresponding Lya image reconstruction.
radius showing the compact source in the centre (ID 1) and the filamentary substructure (IDs 2 and 3). Central panels: colour composite images using the Lyα, C iv and He ii emissions (blue, green and red channels, respectively) of the two LAB in the MUSE footprint, with a smooth kernel of 1″. Right panels: projected emissions onto the source plane. Note that the multiple images C are outside of our MUSE observations, and therefore we cannot show the corresponding Lya image reconstruction.
Current usage metrics show cumulative count of Article Views (full-text article views including HTML views, PDF and ePub downloads, according to the available data) and Abstracts Views on Vision4Press platform.
Data correspond to usage on the plateform after 2015. The current usage metrics is available 48-96 hours after online publication and is updated daily on week days.
Initial download of the metrics may take a while.