Free Access
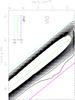
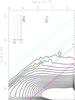
Fig. 5

Contour profiles of O vi and Hα as a function of density and distance, here using a radial slope γ of 0.10. The dashed lines indicates constant ionization parameters as detailed in the legend. The solid magenta line follows the density prediction of the pressure confined emission model of Baskin et al. (2014).
This figure is made of several images, please see below:
Current usage metrics show cumulative count of Article Views (full-text article views including HTML views, PDF and ePub downloads, according to the available data) and Abstracts Views on Vision4Press platform.
Data correspond to usage on the plateform after 2015. The current usage metrics is available 48-96 hours after online publication and is updated daily on week days.
Initial download of the metrics may take a while.