Free Access
Fig. 4
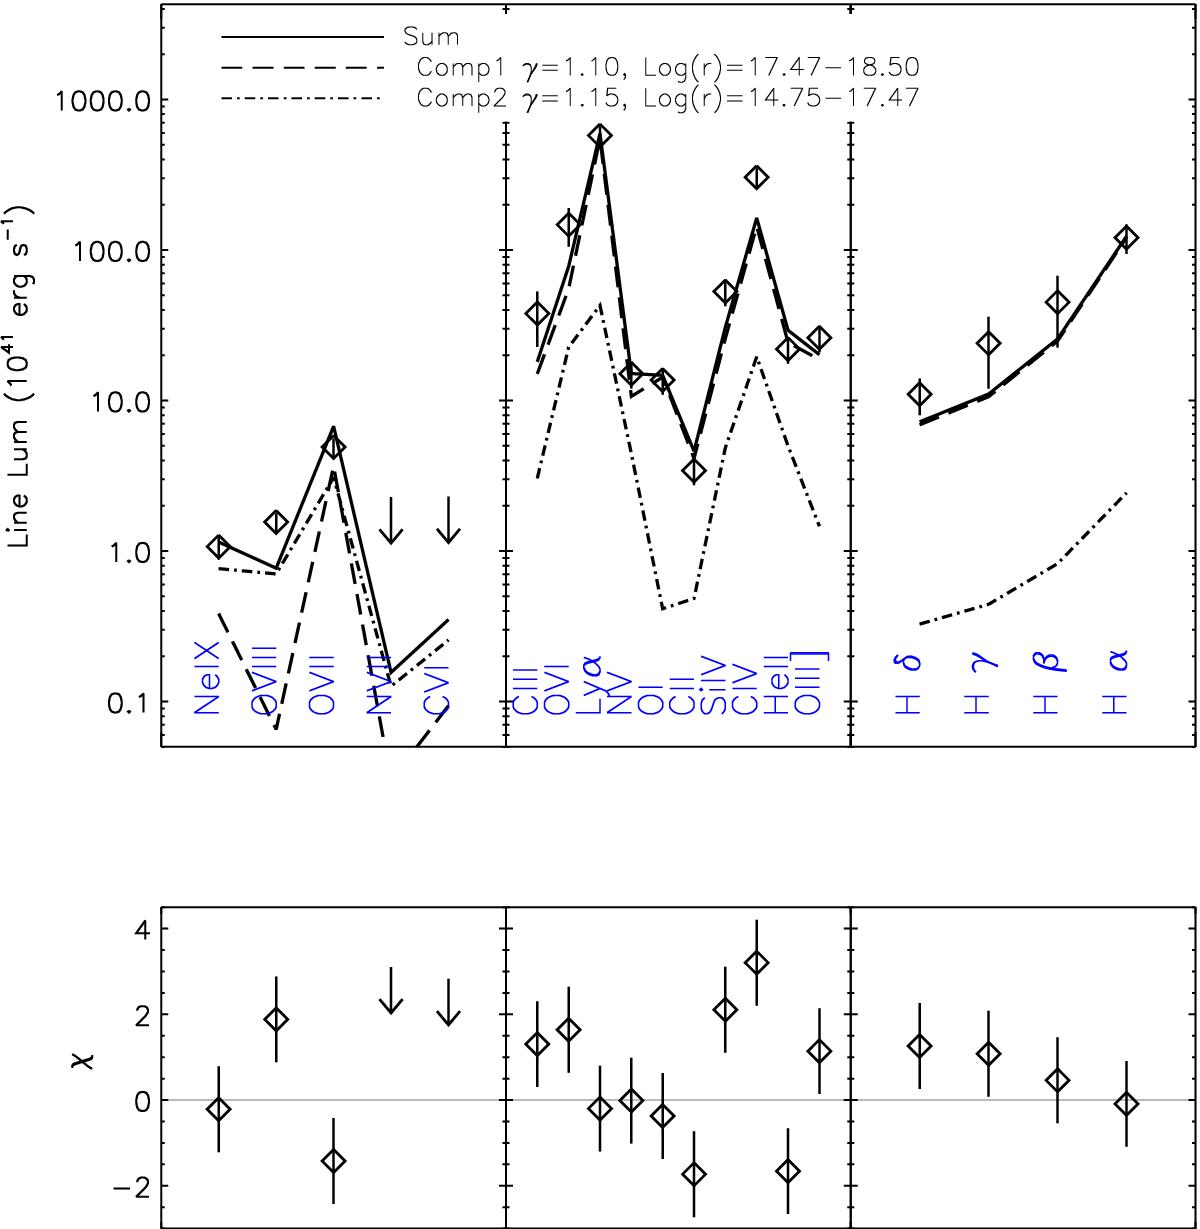
Upper panel: LOC fit with two components, acting in different regions near the AGN (Model 3 in Table 3). X-ray data are best fitted by a component near the black hole, while the optical data are better fitted by a component farther away. Lower panel: residuals to the fit.
Current usage metrics show cumulative count of Article Views (full-text article views including HTML views, PDF and ePub downloads, according to the available data) and Abstracts Views on Vision4Press platform.
Data correspond to usage on the plateform after 2015. The current usage metrics is available 48-96 hours after online publication and is updated daily on week days.
Initial download of the metrics may take a while.