| Issue |
A&A
Volume 595, November 2016
|
|
|---|---|---|
| Article Number | A48 | |
| Number of page(s) | 5 | |
| Section | Extragalactic astronomy | |
| DOI | https://doi.org/10.1051/0004-6361/201527918 | |
| Published online | 26 October 2016 | |
Galaxy metallicities depend primarily on stellar mass and molecular gas mass
1 Cavendish Laboratory, University of
Cambridge, 19 J.J. Thomson
Avenue, Cambridge CB3
0HE, UK
e-mail: This email address is being protected from spambots. You need JavaScript enabled to view it.
2 Kavli Institute for Cosmology,
University of Cambridge, Madingley
Road, Cambridge
CB3 0HA,
UK
3 ETH Zurich, Institute for Astronomy,
Wolfgang-Pauli-Strasse
27, 8093
Zurich,
Switzerland
4 Kavli Institute for Astronomy and
Astrophysics, Peking University, 100871
Beijing, PR
China
5 SKA Organisation, Lower Withington,
Macclesfield, Cheshire, SK11
9DL, UK
Received:
7
December
2015
Accepted:
10
June
2016
Abstract
Aims. We present an analysis of the behaviour of galaxies in a four-dimensional parameter space defined by stellar mass, metallicity, star formation rate, and molecular gas mass. We analyse a combined sample of 227 galaxies that draws from a number of surveys across the redshift range 0 < z < 2 (>90% of the sample at z ~ 0) and covers >3 decades in stellar mass.
Methods. Using principal component analysis, we demonstrate that galaxies in our sample lie on a 2D plane within this 4D parameter space, which is indicative of galaxies that exist in an equilibrium between gas inflow and outflow. Furthermore, we find that the metallicity of galaxies depends only on stellar mass and molecular gas mass. In other words, gas-phase metallicity has a negligible dependence on star formation rate once the correlated effect of molecular gas content is accounted for.
Results. The well-known fundamental metallicity relation which describes a close and tight relationship between metallicity and SFR (at fixed stellar mass) is therefore entirely a by-product of the underlying physical relationship with molecular gas mass (through the Schmidt-Kennicutt relation).
Key words: galaxies: ISM / galaxies: statistics / galaxies: evolution / galaxies: abundances
© ESO, 2016
1. Introduction
The abundance of heavy elements within the interstellar medium (ISM) of galaxies remains one of the most important diagnostics of the galaxy evolution process. Heavy elements are produced by supernovae, and the metallicity (the abundance of these heavy elements relative to hydrogen, traced through the oxygen-to-hydrogen ratio O/H) is affected by both gas inflows and outflows. The metallicity of galaxies therefore effectively functions as a “fossil record” of the physical processes driving their past evolution. Attaining a comprehensive understanding of the factors affecting the metal abundance of galaxies is therefore a critical goal of galaxy evolution studies.
It has long been known that metallicity correlates with a host of physical parameters, the most well-known being the correlation with stellar mass (the mass-metallicity relation), whereby the stellar mass and gas-phase metallicity of galaxies are closely correlated across a wide range of masses (e.g. Tremonti et al. 2004; Lee et al. 2006), and out to high redshift (e.g. Savaglio et al. 2005; Maiolino et al. 2008). The existence of the mass-metallicity relation has become a central pillar of our understanding of galaxy evolution and a key observable for theoretical models to reproduce. In recent years, authors have sought to address secondary correlations in the mass-metallicity relation. Ellison et al. (2008), Mannucci et al. (2010), and Lara-López et al. (2010) found a significant secondary dependence on star formation rate (SFR), such that galaxies at a fixed stellar mass displayed an inverse correlation between metallicity and SFR. Known as the fundamental metallicity relation (FMR), in this formalism galaxies can be pictured as lying on a 2D plane in the 3D parameter space defined by stellar mass, metallicity, and star formation rate. The mass-metallicity relation, and the SFR-M∗ “main sequence” are therefore best understood as being projections of this underlying 3D distribution along either the SFR axis or the metallicity axis (respectively). Interestingly, the existence of the FMR naturally explains the observed redshift evolution of the mass-metallicity relation: galaxies at high redshifts have elevated SFRs relative to z ~ 0, and these higher SFRs result in concomitantly lower metallicities. Galaxies at high-z are not discrepant from the local mass-metallicity relation; instead, they lie on a different region of the FMR.
The discovery of the interrelation between stellar mass, metallicity, and SFR has prompted extensive follow-up efforts to understand the physics driving these observed correlations. Theoretical models suggest that these relations result from galaxies existing in an equilibrium between gas inflows and gas outflows (Mannucci et al. 2010; Dayal et al. 2013; Hunt et al. 2012; Lilly et al. 2013; Davé et al. 2013; Obreja et al. 2014), while some observational results suggested that the FMR may in fact be more strongly expressed through gas content than SFR (Bothwell et al. 2013a). Zahid et al. (2014) derived a model whereby the FMR is best understood as a by-product of an underlying relationship between metallicity and gas fraction: this model is supported by the results presented by Bothwell et al. (2016), who demonstrated observationally that the SFR-FMR is likely to be a by-product of a more fundamental relation between stellar mass, metallicity, and molecular gas mass.
In this work, we present a new 4-dimensional principal component analysis (PCA) of a large sample of galaxies lying between 0 <z< 2. Previous observational analyses undertaken with the aim of studying the FMR have been hampered by the degeneracy between SFR and M(H2), which are linked by the star formation law. Bothwell et al. (2016) compared the SFR-FMR (the 3D relation between stellar mass, metallicity, and SFR) with the H2-FMR (the 3D relation between stellar mass, metallicity, and M(H2)). In this work we directly compare the effects of both SFR and M(H2) on the mass-metallicity relation by carrying out a 4-dimensional PCA. The use of a 4-dimensional PCA allows us to break the degeneracy between SFR and M(H2) and uncover the primary driving mechanism behind the FMR. We demonstrate that the observed SFR-FMR is indeed entirely a by-product of the true underlying relation between metallicity and molecular gas, with the SFR-FMR emerging as a result of the combination of (a) the metallicity-gas mass correlation; and (b) the star formation law. Once the correlated effect of molecular gas mass has been removed, the metallicity shows essentially zero remaining dependence on star formation rate. We discuss our sample selection in Sect. 2 and give our results in Sect. 3. We discuss these results in Sect. 4 and conclude in Sect. 5. Throughout, we adopt a cosmology following Planck Collaboration XIII (2016) and a Chabrier (2003) IMF.
2. Sample selection
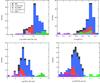 |
Fig. 1 Histograms of the stellar mass (upper left panel), metallicities (upper right panel), star formation rates (lower left panel), and molecular gas masses (lower right panel) of galaxies. Bars are shown as stacks that separate the different samples. |
Our sample draws from a number of surveys in both the local and high-z Universe. Locally, we draw galaxies from the ALLSMOG (Bothwell et al. 2014), COLD GASS (Saintonge et al. 2011), the Herschel Reference Survey (HRS; Boselli et al. 2010), and the Local Volume Legacy (LVL; Lee et al. 2009; Marble et al. 2010) surveys. We also include “optically selected main-sequence” galaxies at high redshift selected from the PHIBBS survey (Tacconi et al. 2013), and luminous sub-millimetre galaxies (SMGs; Chapman et al. 2005; Bothwell et al. 2013b). Overall, our sample selection was driven by the need to have a range of available physical parameters: namely, the stellar mass, SFR, gas-phase metallicity, and molecular gas mass. The simultaneous availability of these latter two parameters was generally the limiting factor defining inclusion into our final sample.
We also include a sample of eight low-metallicity dwarf galaxies presented by Hunt et al. (2015). These galaxies have molecular gas masses measured by IRAM 30 m observations of their 12CO(1−0) emission line, SFRs measured using a combination of Hα and 24 μm luminosities, and have metallicities in the range 7.7 < 12+log(O/H) <8.4 (making them amongst the lowest metallicity galaxies with CO detections). The inclusion of these eight galaxies serves to increase the range of metallicities probed by our analysis. We rederived stellar masses for the galaxies presented by Hunt et al. (2015), as the original stellar masses were derived using 3.4 μm luminosities, which are potentially contaminated by hot dust emission. We derived stellar masses using archival 2MASS H-band luminosities and (B − V) optical colours, following the mass-to-light method of Bell & de Jong (2001). This rederivation lowers the Hunt et al. (2015) stellar masses by a factor of ~3.
Throughout this work, we derived molecular gas masses using the metallicity-dependent CO/H2 conversion factor presented by Wolfire et al. (2010). The Wolfire et al. (2010) factor depends only weakly on radiation field intensity and gas density, scaling as ln(χ/n). Following Bolatto et al. (2013), we have taken χ/n = 1 × 10⁻², while order-of-magnitude changes in χ/n result in changes to αCO of ~10−20%. Our results are robust to a range of metallicity-dependent CO/H2 conversion factors (i.e. Feldmann et al. 2012; Glover & Mac Low 2011; Narayanan et al. 2012, in addition to our chosen prescription, Wolfire et al. 2010), although the use of conversion factor prescriptions with very steep (n> 2) power-law dependences on metallicity (i.e. Israel 1997; Schruba et al. 2012) may alter our results.
We derived metallicities for our low-z samples by taking the mean of the metallicity derived using the R23 and [NII]/Hα tracers, using the calibration of Maiolino et al. (2008). At high redshift, with fewer available optical lines, we derived metallicities using the [NII]/Hα tracer alone. Our sample selection is identical to that presented in Bothwell et al. (2016), and we refer to that work for further detail. Our low-z samples and high-z main sequence galaxies have typical values of αCO in the range 2.5−4.5. High-z SMGs are dynamically turbulent systems with values of αCO driven more by the kinematics of their ISM than their metallicity. We have adopted a conventional value of αCO = 0.8 for all SMGs (as we discuss below, adopting instead a metallicity-dependent αCO for SMGs does not significantly affect our results).
Our final combined sample of galaxies consists of 227 members, spanning a redshift range 0 <z< 2, although the majority of the sample (>90%) is drawn from local surveys (z ~ 0). Figure 1 shows the properties of our combined sample in the form of histograms of stellar mass, metallicity, SFR, and molecular gas mass.
3. Analysis and results
Bothwell et al. (2016) presented a 3-dimensional PCA of our data, analysing the stellar mass, metallicity, and a third parameter of interest (in turn, the molecular gas mass, the total gas mass, the SFR, and the star formation efficiency). We found that the 3D relation between stellar mass, metallicity, and molecular gas mass is stronger, and therefore likely to be more fundamental, than the 3D relation defined by stellar mass, metallicity, and SFR (which is equivalent to the FMR, as presented by Mannucci et al. 2010 and Lara-López et al. 2010). As such, the driver of the FMR was most likely the molecular gas content.
Here, we improve upon the results presented by Bothwell et al. (2016) in two ways. Firstly, by including additional low-mass galaxies (taken from observations by Hunt et al. (2015), and additional ALLSMOG galaxies). Secondly, and most importantly, for the first time we directly perform a single simultaneous 4-dimensional PCA on the four parameters stellar mass, metallicity, SFR, and molecular gas mass.
Principal component analysis is a parameter transformation technique whereby a set of physical parameters are converted into a set of orthogonal (and linearly uncorrelated) vectors, or principal components. The transformation is defined such that the maximum amount of variance is contained within the first principal component, and then each subsequent component contains as much remaining variance as possible (with the constraint that every component remains orthogonal). In practice, PCA performs a coordinate transformation that (a) reveals the optimum projection of a dataset, and (b) reveals which parameters are responsible for the variance in the sample. PCA is particularly useful for revealing any possible reduction in dimensionality, for example, by revealing that some dataset lies on a 2D plane in 3D parameter space. PCA was used by both Lara-López et al. (2010) and Hunt et al. (2012) to examine the mass-metallicity relation’s secondary dependence on SFR.
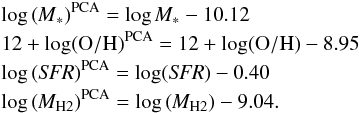
We first normalised each parameter to the mean value for our combined sample:
 We accounted for uncertainty by performing a Monte Carlo bootstrap, performing 105 PCA iterations. During each iteration, each galaxy has the its physical parameters randomly perturbed by an amount defined by the respective error on each parameter. After performing 105 iterations, we took our final Eigenvector values (and uncertainties) to be the mean (and standard deviation) of the resulting Eigenvector distribution. To ensure that we are not unduly influenced by outliers, we also performed sample bootstrapping: during each iteration, we randomly sampled with replacement our complete sample of galaxies, generating for each iteration a new sample, with a size equal to our original dataset.
It is important to note that the application of PCA to our data has a potential weakness: the fact that PCA can only describe datasets in terms of linear relationships between parameters. More complex, non-linear distributions of data cannot be described in terms of a simple set of orthogonal eigenvectors. While linear correlations (such as the SFR-M∗ galaxy main sequence) are easily described by PCA, applying PCA to non-linear relations (such as the mass-metallicity relation) will, by definition, be somewhat inaccurate. The practical effect of this will be to increase the apparent scatter around the component vectors. Given the relatively low number of galaxies in our sample, it is likely that the uncertainty added by describing our dataset in terms of purely linear relations is not larger than the scatter inherent in the distribution of data (which our Monte Carlo technique is designed to reveal). We therefore caution that the results revealed by PCA may have some uncertainty added as a result of the non-linearity in some underlying correlations.
In addition, we note that while we included galaxies drawn from samples of various sizes, we did not apply any reweighting based on the parent sample; weighting by sample size would unfairly privilege members of smaller samples (there is nothing inherent about being drawn from a smaller sample that would require a galaxy to be given higher weighting), and weighting by the neighbouring density of points would give disproportionate weighting to outliers. We therefore weighted each individual galaxy equally.
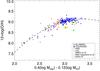 |
Fig. 2 Our fourth principal component, plotted as metallicity (12+log(O/H)) vs. the optimum linear combination of stellar mass, and molecular gas mass. We did not include the contribution from SFR because it is essentially zero: the optimum projection of the data requires only the stellar mass and molecular gas mass. The quadratic fit, defined in Eq. (1), is overplotted as a dashed line. Galaxies with only upper limits on their H2 mass are not shown (to avoid crowding the plot), but are consistent with the derived relation. |
We found that our PCA results demonstrate the existence of a fundamental plane in the 4-dimensional parameter space defined by stellar mass, metallicity, SFR, and molecular gas mass. The first two 4-vectors (defining a 2D plane) are together responsible for 93% of all the variance in the data.
The four principal components defining our combined dataset are 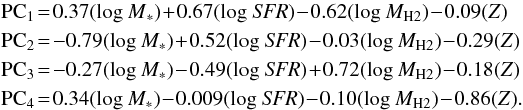 Seventy-seven percent of the sample variance is contained within PC1, 93% is contained within (PC1 + PC2), and 98% of the sample variance is contained within (PC1 + PC2 + PC3). The fourth principal component, PC4, is therefore essentially zero (to within 2%). The fact that the vast majority (93%) of the sample variance is contained within two vectors shows that the distribution of all galaxies in our sample does indeed lie on a plane in this 4D space, with just 7% of the sample variance taking the form of scatter around this plane.
As PC4 is (a) essentially zero and (b) dominated by metallicity, we can therefore solve for metallicity by setting the fourth principal component equal to zero (which, as above, is valid at the ~2% level), allowing us to write an expression for metallicity in terms of the other physical parameters.
Setting PC4 to zero therefore gives us the optimal projection of the combined dataset:  (1)This tells us that the gas-phase metallicity of galaxies in our sample is determined primarily by the stellar mass (i.e. the well-known mass-metallicity relation), with a secondary dependence on the molecular gas mass (the effect of which is ~30% as strong as the stellar mass dependence) and a vanishingly small dependence on SFR (the effect of which is ~2% as strong as the stellar mass dependence). This result is only slightly affected by varying our assumptions as discussed above; adopting a metallicity-dependent CO/H2 conversion factor for the z ~ 2 SMGs rather than a constant αCO = 0.8 results in the expression Metallicity = 0.4(log M∗) − 0.14(log MH2) − 0.03(log SFR), that is, a slightly higher SFR dependence than given in Eq. (1), but leaving the underlying result unchanged. Likewise, we can examine the effect of removing starburst galaxies (systems that may not be in a current equilibrium between inflows/outflows/SF); removing starburst galaxies, defined here as τdep(= MH2/SFR) < 2 × 10⁸ yr, results in an optimum projection Metallicity = 0.4(log M∗) − 0.11(log MH2) − 0.02(log SFR).
We have plotted the optimum projection of our data (Eq. (1)) in Fig. 2. We fit a quadratic function to the data, finding that the metallicity of all galaxies in our sample follows  (2)where ξ = 0.4(log M∗) − 0.12(log MH2).
We note that Eq. (2) gives the best representation of our dataset. Equation (1) shows the optimum projection of the data (close to a 2D plane in the 4D parameter space), but of course the data do not have to follow a linear trend on this plane. To avoid overcrowding Fig. 2, we do not plot the positions of galaxies not detected in CO (which therefore have only limits on their molecular gas masses). We stress, however, that these limits are consistent with the relation. We also note that the high-z galaxies seem to lie slightly below the relation; while this could be due to uncertainty in the metallicity measurements at high-z, it could also hint at evolution in the physics driving the FMR. Such an analysis is beyond the scope of this letter, however.
We note that the projection of the data shown in Fig. 2 is similar in form to the mass-metallicity relation, with a second-order correction for gas mass. The new result we report here is that the SFR is not needed to find the optimum projection of the data. Our principal component analysis has led to the surprising result that the gas-phase metallicity has a negligible dependence on SFR once the correlated effect of molecular gas content is accounted for.
The well-known FMR, which describes a close and tight relationship between metallicity and SFR (at a given stellar mass) is therefore entirely an incidental by-product of the underlying physical relationship with molecular gas mass (which is linked to SFR through the Kennicutt-Schmidt star formation law).
4. Total gas mass
Given our finding that the observed FMR is driven by an underlying physical connection between stellar mass, metallicity, and molecular gas content, it is important to discover whether the most fundamental gas component is indeed the molecular gas mass, or if the total gas mass (Hi + H2) is more important.
We performed the same PCA exercise as above, replacing the molecular gas mass with the total gas mass, M(gas) = 1.36 × (MHI + MH2), where the factor of 1.36 is a correction for interstellar helium. 21 cm Hi observations are available for all of the low-redshift galaxies. Hi is not detectable at high redshifts, and it is generally assumed that the ISM of high-redshift star-forming galaxies has only a negligible Hi component. For our high-z galaxies, we therefore assumed M(gas) = M(H2).
This analysis reveals a distribution with more scatter than that with molecular gas alone; 69% of the sample variance is contained within PC1, 88% is contained within (PC1 + PC2), and 98% of the sample variance is contained within (PC1 + PC2 + PC3). The data lie on an approximate plane in the 4-dimensional parameter space defined by stellar mass, metallicity, SFR, and total gas mass, with 12% of the sample variance taking the form of scatter around this plane. Performing the same rearrangement of the fourth principal component as above, we reach an expression for metallicity
 The strong correlation between molecular gas mass and metallicity is not present between metallicity and total (Hi + H2) gas mass. This can be explained as being due to the fact that gas-phase metallicity, which is measured using optical nebular emission lines, is observed in star-forming regions of galaxies. These same regions will be rich in molecular gas (as stars form in molecular clouds). Atomic hydrogen, conversely, can exist in a vast halo reaching far beyond the central star-forming regions of the galaxy. A gas accretion event that increases M(Hi) will not necessarily elevate the SFR or dilute the observed metallicity. It is therefore unsurprising that including the atomic gas component serves to weaken the correlations observed between metallicity and molecular gas mass.
5. Conclusions
We have presented a four-dimensional principal component analysis on a sample of 227 galaxies, ranging from low-metallicity dwarfs to massive starbursts, lying at redshifts 0 <z< 2. Our sample was selected to have a full complement of stellar mass, metallicity, molecular gas mass, and SFR data. Our 4D PCA has revealed two main conclusions:
-
Our sample of galaxies lies on a 2D plane in the four-dimensional parameter space defined by stellar mass, metallicity, molecular gas mass, and SFR, with 93% of all the sample variance being contained within the first two principal components.
-
Setting the fourth principal component to zero, we find an expression for metallicity in terms of stellar mass, SFR, and molecular gas mass. We find that the star formation rate has a negligible effect on the metallicity of galaxies in our sample. As such, we conclude that the strong SFR-metallicity relation at a given stellar mass (the FMR) is entirely a by-product of the true, physical relation between metallicity and molecular gas content.
Acknowledgments
This research has made use of NASA’s Astrophysics Data System. ALLSMOG data are available at http://www.mrao.cam.ac.uk/ALLSMOG/. This work is supported by Science and Technology Facilities Council grants ST/M001172/1 and ST/K003119/1.
References
- Bell, E. F., & de Jong, R. S. 2001, ApJ, 550, 212 [NASA ADS] [CrossRef] [Google Scholar]
- Boselli, A., Eales, S., Cortese, L., et al. 2010, PASP, 122, 261 [NASA ADS] [CrossRef] [Google Scholar]
- Bothwell, M. S., Maiolino, R., Kennicutt, R., et al. 2013a, MNRAS, 433, 1425 [NASA ADS] [CrossRef] [Google Scholar]
- Bothwell, M. S., Smail, I., Chapman, S. C., et al. 2013b, MNRAS, 429, 3047 [NASA ADS] [CrossRef] [Google Scholar]
- Bothwell, M. S., Wagg, J., Cicone, C., et al. 2014, MNRAS, 445, 2599 [NASA ADS] [CrossRef] [Google Scholar]
- Bothwell, M. S., Maiolino, R., Peng, Y., Cicone, C., Griffith, H., & Wagg, J. 2016, MNRAS, 455, 1156 [NASA ADS] [CrossRef] [Google Scholar]
- Chabrier, G. 2003, PASP, 115, 763 [NASA ADS] [CrossRef] [Google Scholar]
- Chapman, S. C., Blain, A. W., Smail, I., & Ivison, R. J. 2005, ApJ, 622, 772 [NASA ADS] [CrossRef] [Google Scholar]
- Davé, R., Katz, N., Oppenheimer, B. D., Kollmeier, J. A., & Weinberg, D. H. 2013, MNRAS, 434, 2645 [NASA ADS] [CrossRef] [Google Scholar]
- Dayal, P., Ferrara, A., & Dunlop, J. S. 2013, MNRAS, 430, 2891 [NASA ADS] [CrossRef] [Google Scholar]
- Ellison, S. L., Patton, D. R., Simard, L., & McConnachie, A. W. 2008, ApJ, 672, 107 [Google Scholar]
- Feldmann, R., Gnedin, N. Y., & Kravtsov, A. V. 2012, ApJ, 747, 124 [NASA ADS] [CrossRef] [Google Scholar]
- Glover, S. C. O., & Mac Low, M.-M. 2011, MNRAS, 412, 337 [NASA ADS] [CrossRef] [MathSciNet] [Google Scholar]
- Hunt, L., Magrini, L., Galli, D., et al. 2012, MNRAS, 427, 906 [NASA ADS] [CrossRef] [Google Scholar]
- Hunt, L. K., Garcia-Burillo, S., Casasola, V., et al. 2015, A&A, 583, A114 [NASA ADS] [CrossRef] [EDP Sciences] [Google Scholar]
- Israel, F. P. 1997, A&A, 328, 471 [NASA ADS] [Google Scholar]
- Lara-López, M. A., Cepa, J., Bongiovanni, A., et al. 2010, A&A, 521, L53 [NASA ADS] [CrossRef] [EDP Sciences] [Google Scholar]
- Lee, H., Skillman, E. D., Cannon, J. M., et al. 2006, ApJ, 647, 970 [NASA ADS] [CrossRef] [Google Scholar]
- Lee, J. C., Gil de Paz, A., Tremonti, C., et al. 2009, ApJ, 706, 599 [NASA ADS] [CrossRef] [Google Scholar]
- Lilly, S. J., Carollo, C. M., Pipino, A., Renzini, A., & Peng, Y. 2013, ApJ, 772, 119 [NASA ADS] [CrossRef] [Google Scholar]
- Maiolino, R., Nagao, T., Grazian, A., et al. 2008, A&A, 488, 463 [NASA ADS] [CrossRef] [EDP Sciences] [Google Scholar]
- Mannucci, F., Cresci, G., Maiolino, R., Marconi, A., & Gnerucci, A. 2010, MNRAS, 408, 2115 [NASA ADS] [CrossRef] [Google Scholar]
- Marble, A. R., Engelbracht, C. W., van Zee, L., et al. 2010, ApJ, 715, 506 [NASA ADS] [CrossRef] [Google Scholar]
- Narayanan, D., Krumholz, M. R., Ostriker, E. C., & Hernquist, L. 2012, MNRAS, 421, 3127 [NASA ADS] [CrossRef] [Google Scholar]
- Obreja, A., Brook, C. B., Stinson, G., et al. 2014, MNRAS, 442, 1794 [NASA ADS] [CrossRef] [Google Scholar]
- Planck Collaboration XIII. 2016, A&A, 594, A13 [NASA ADS] [CrossRef] [EDP Sciences] [Google Scholar]
- Saintonge, A., Kauffmann, G., Kramer, C., et al. 2011, MNRAS, 415, 32 [NASA ADS] [CrossRef] [Google Scholar]
- Savaglio, S., Glazebrook, K., Le Borgne, D., et al. 2005, ApJ, 635, 260 [NASA ADS] [CrossRef] [Google Scholar]
- Schruba, A., Leroy, A. K., Walter, F., et al. 2012, AJ, 143, 138 [NASA ADS] [CrossRef] [Google Scholar]
- Tacconi, L. J., Neri, R., Genzel, R., et al. 2013, ApJ, 768, 74 [Google Scholar]
- Tremonti, C. A., Heckman, T. M., Kauffmann, G., et al. 2004, ApJ, 613, 898 [NASA ADS] [CrossRef] [Google Scholar]
- Wolfire, M. G., Hollenbach, D., & McKee, C. F. 2010, ApJ, 716, 1191 [NASA ADS] [CrossRef] [Google Scholar]
- Zahid, H. J., Dima, G. I., Kudritzki, R.-P., et al. 2014, ApJ, 791, 130 [NASA ADS] [CrossRef] [Google Scholar]
All Figures
|
Fig. 1 Histograms of the stellar mass (upper left panel), metallicities (upper right panel), star formation rates (lower left panel), and molecular gas masses (lower right panel) of galaxies. Bars are shown as stacks that separate the different samples. |
| In the text | |
|
Fig. 2 Our fourth principal component, plotted as metallicity (12+log(O/H)) vs. the optimum linear combination of stellar mass, and molecular gas mass. We did not include the contribution from SFR because it is essentially zero: the optimum projection of the data requires only the stellar mass and molecular gas mass. The quadratic fit, defined in Eq. (1), is overplotted as a dashed line. Galaxies with only upper limits on their H2 mass are not shown (to avoid crowding the plot), but are consistent with the derived relation. |
| In the text | |
Current usage metrics show cumulative count of Article Views (full-text article views including HTML views, PDF and ePub downloads, according to the available data) and Abstracts Views on Vision4Press platform.
Data correspond to usage on the plateform after 2015. The current usage metrics is available 48-96 hours after online publication and is updated daily on week days.
Initial download of the metrics may take a while.