Free Access
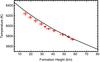
Fig. 9
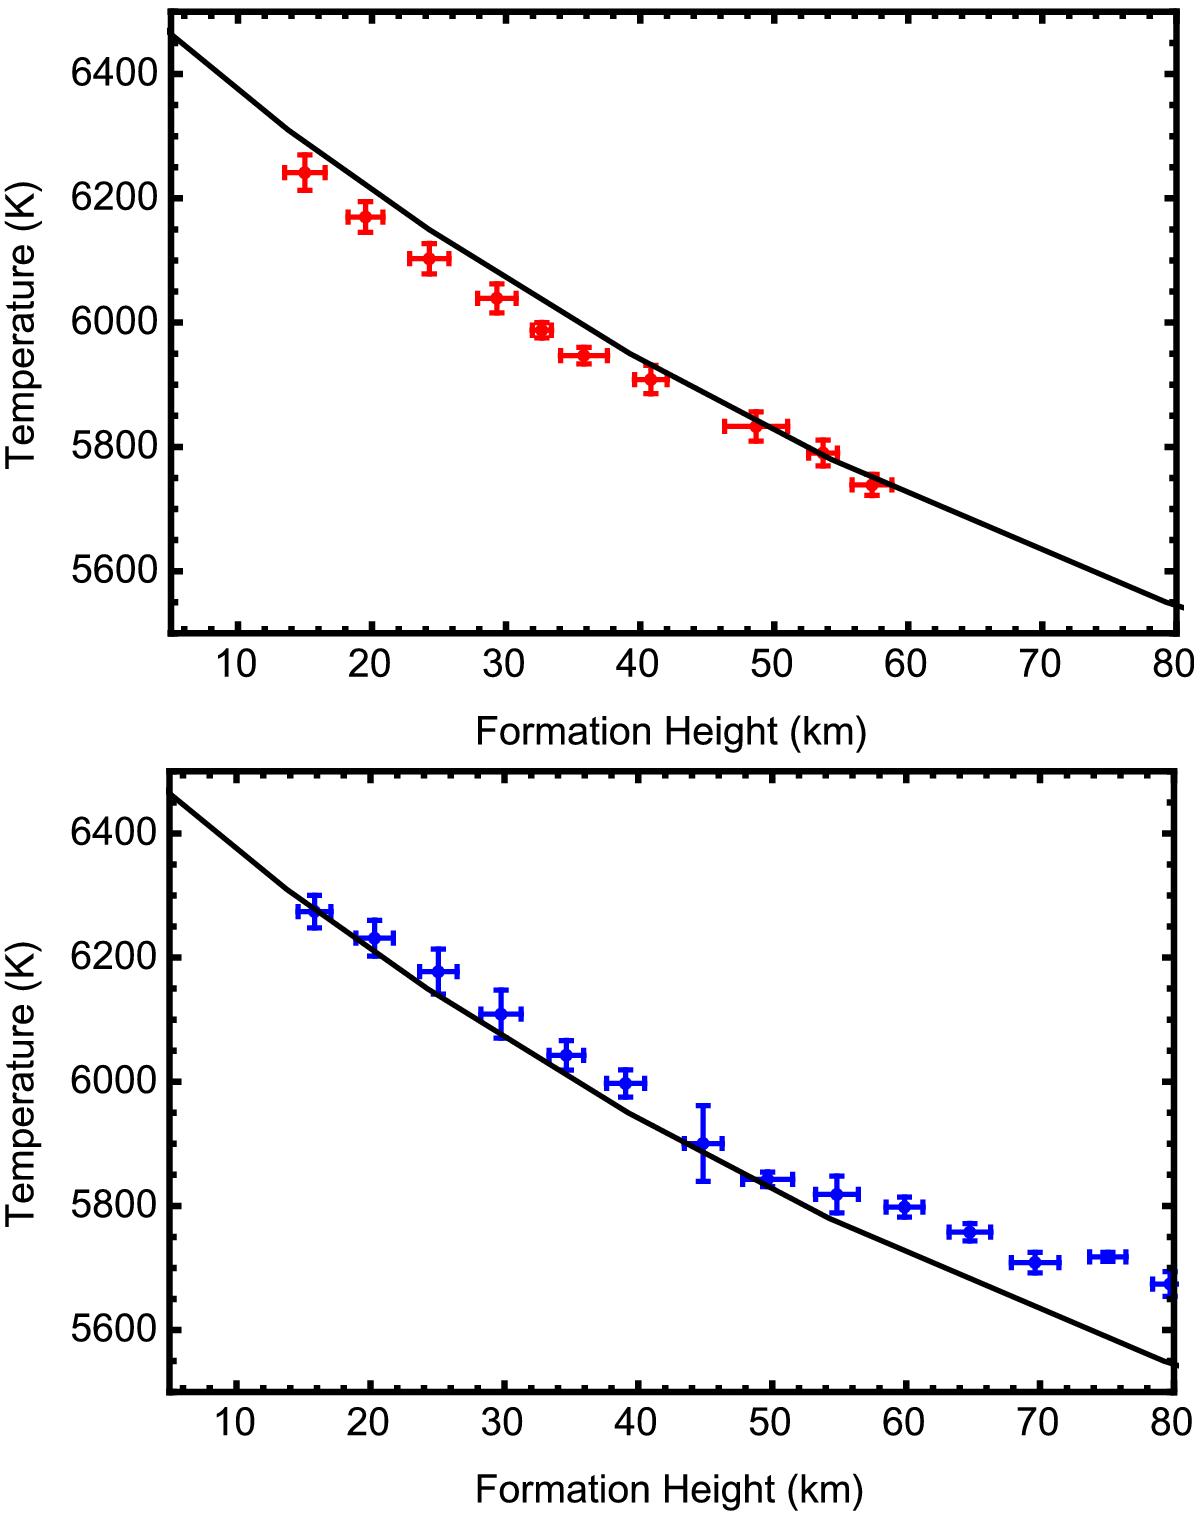
Average value of T measured on 5 km wide z-intervals in the northern hemisphere. The bars show the standard deviation of the measurements on z and T on each interval. The full line shows the FALC quiet-Sun model. Upper panel: 2013 INR images; lower panel: 2007 INR images.
This figure is made of several images, please see below:
Current usage metrics show cumulative count of Article Views (full-text article views including HTML views, PDF and ePub downloads, according to the available data) and Abstracts Views on Vision4Press platform.
Data correspond to usage on the plateform after 2015. The current usage metrics is available 48-96 hours after online publication and is updated daily on week days.
Initial download of the metrics may take a while.