Fig. 5
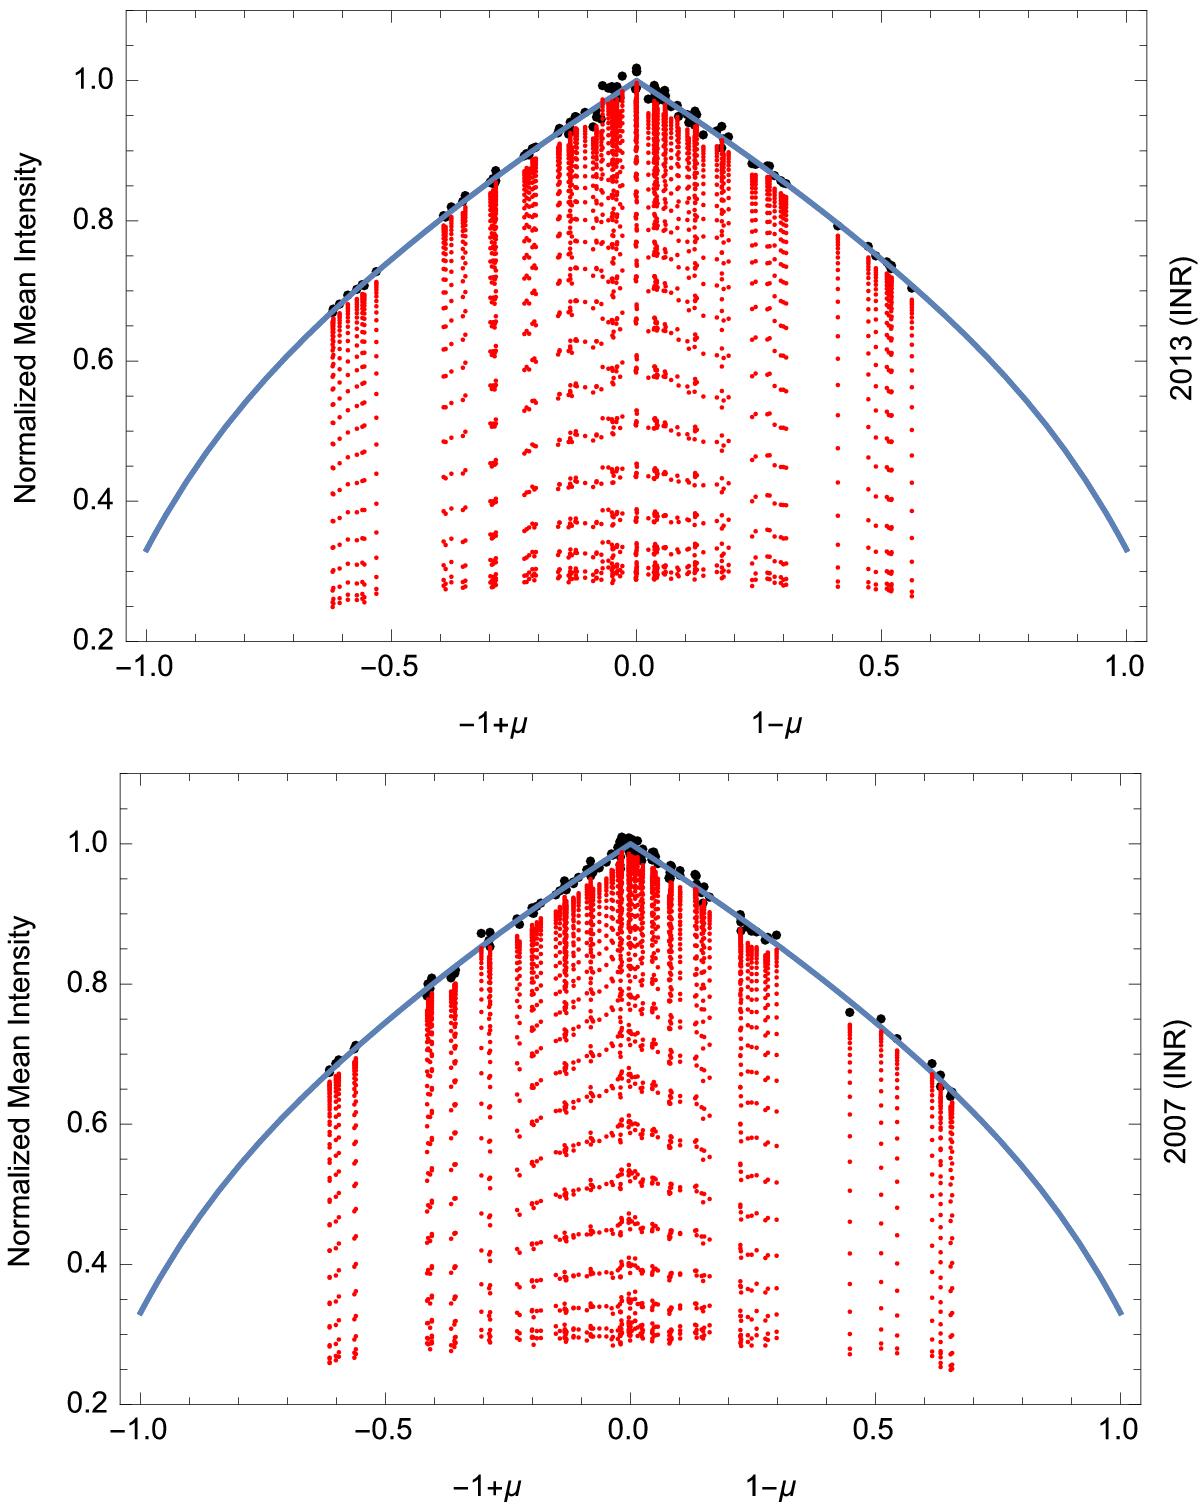
Normalized average intensity in the images for the 25 line levels and in the continuum as functions of 1 − μ in the northern hemisphere and of − 1 + μ in the southern hemisphere. The full curve shows the fifth-order polynomial fit of the 630 nm-continuum center-to-limb variation proposed in Neckel (2005). Upper panel: 2013 data in the selected INR images; lower panel: 2007 data in the selected INR images.
Current usage metrics show cumulative count of Article Views (full-text article views including HTML views, PDF and ePub downloads, according to the available data) and Abstracts Views on Vision4Press platform.
Data correspond to usage on the plateform after 2015. The current usage metrics is available 48-96 hours after online publication and is updated daily on week days.
Initial download of the metrics may take a while.