Free Access
Fig. A.10
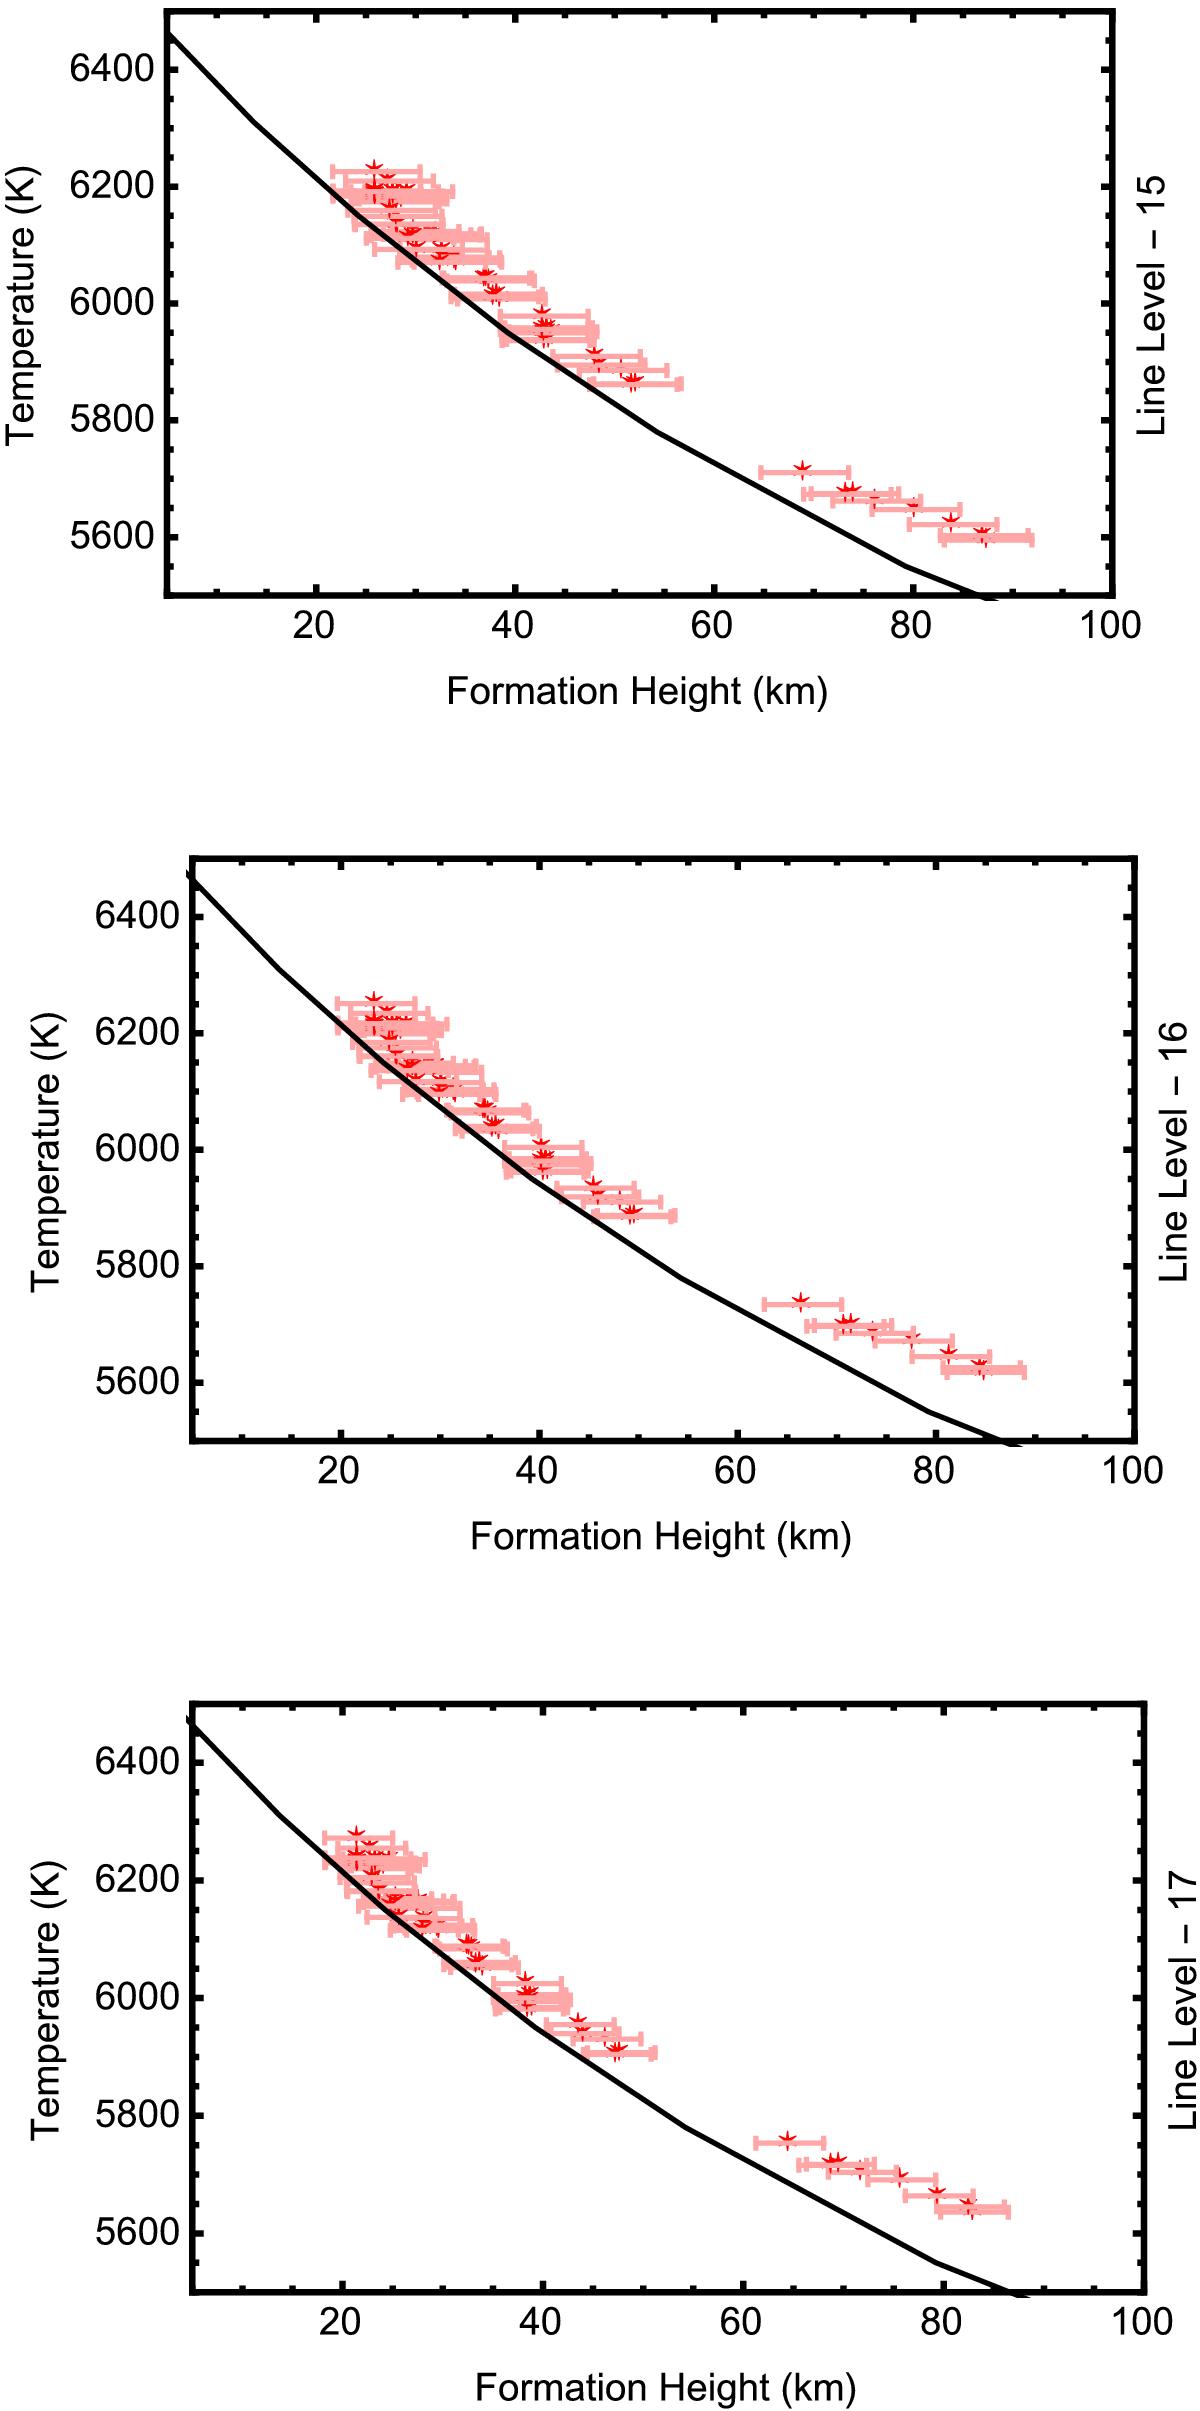
Measurements of the radiation temperature as a function of the line-level formation depth in the southern hemisphere in 2013 for line levels 15 to 17. The bars show the one-sigma error estimate on the measurement of the formation depth (see text). The full line shows the FALC model.
Current usage metrics show cumulative count of Article Views (full-text article views including HTML views, PDF and ePub downloads, according to the available data) and Abstracts Views on Vision4Press platform.
Data correspond to usage on the plateform after 2015. The current usage metrics is available 48-96 hours after online publication and is updated daily on week days.
Initial download of the metrics may take a while.