Free Access
Fig. 12
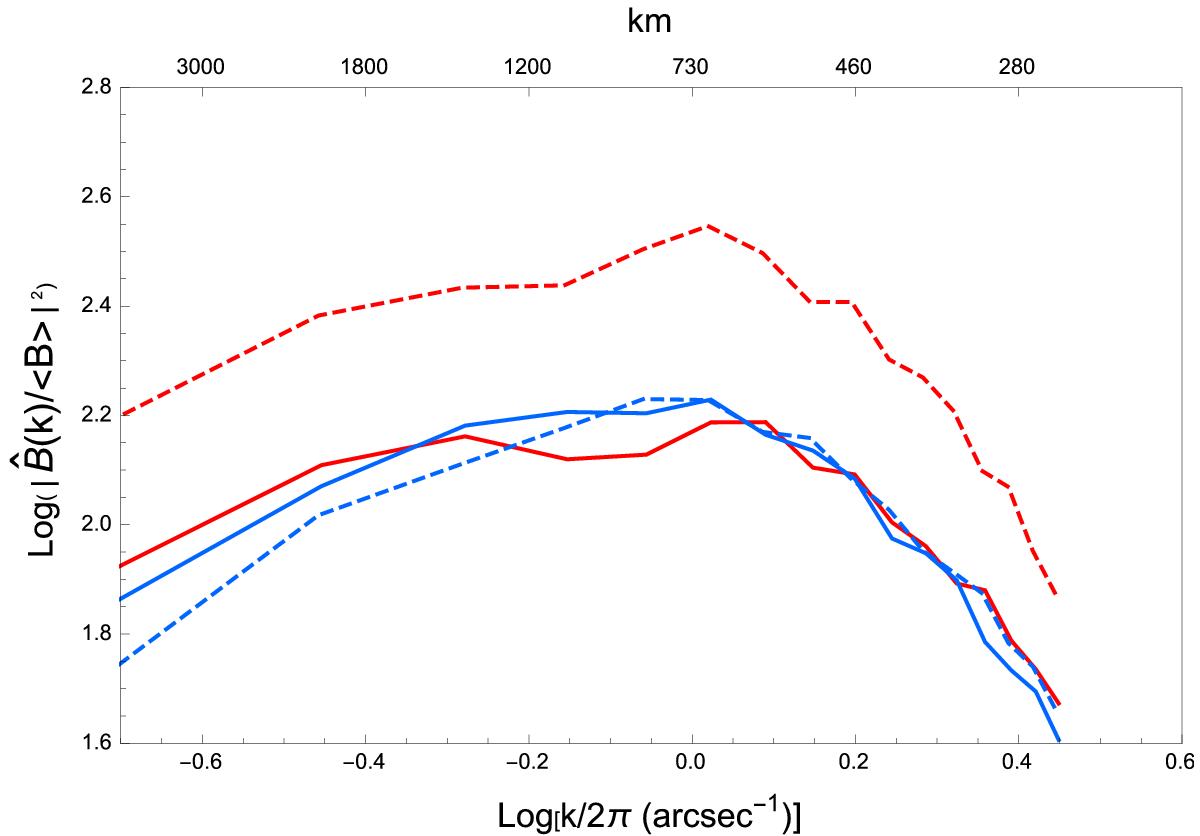
Reduced power Fourier spectra of the unsigned magnetic flux distribution in INR at two symmetrical latitudes at ± 27°. Blue curves: in the 2007 sample; red curves: in the 2013 sample. Full lines: southern hemisphere, dashed lines: northern hemisphere.
Current usage metrics show cumulative count of Article Views (full-text article views including HTML views, PDF and ePub downloads, according to the available data) and Abstracts Views on Vision4Press platform.
Data correspond to usage on the plateform after 2015. The current usage metrics is available 48-96 hours after online publication and is updated daily on week days.
Initial download of the metrics may take a while.