Free Access
Fig. 11
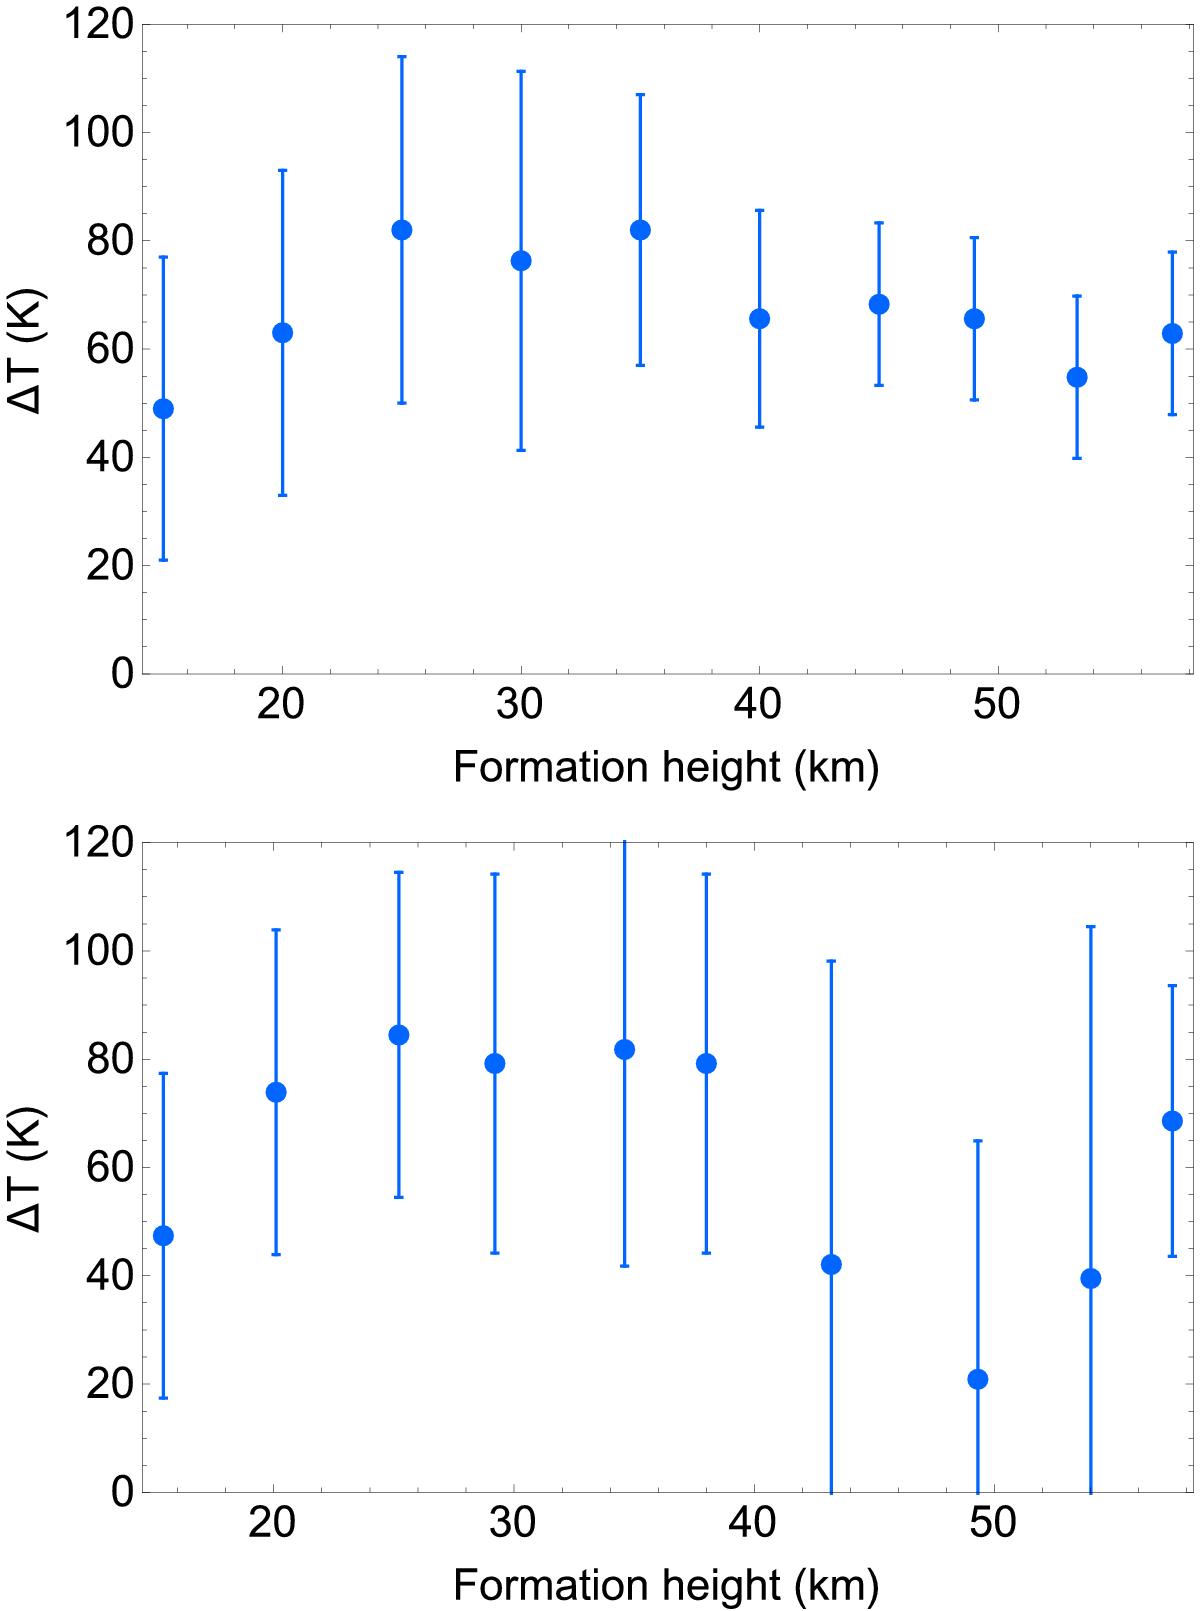
Temperature differences derived from the average (T,z) relations. Upper panel: hemispheric difference between south and north in 2013; lower panel: difference between 2007 and 2013 in the northern hemisphere. The bars show one standard deviation on the temperature difference in each z-interval.
This figure is made of several images, please see below:
Current usage metrics show cumulative count of Article Views (full-text article views including HTML views, PDF and ePub downloads, according to the available data) and Abstracts Views on Vision4Press platform.
Data correspond to usage on the plateform after 2015. The current usage metrics is available 48-96 hours after online publication and is updated daily on week days.
Initial download of the metrics may take a while.