Free Access
Fig. 1
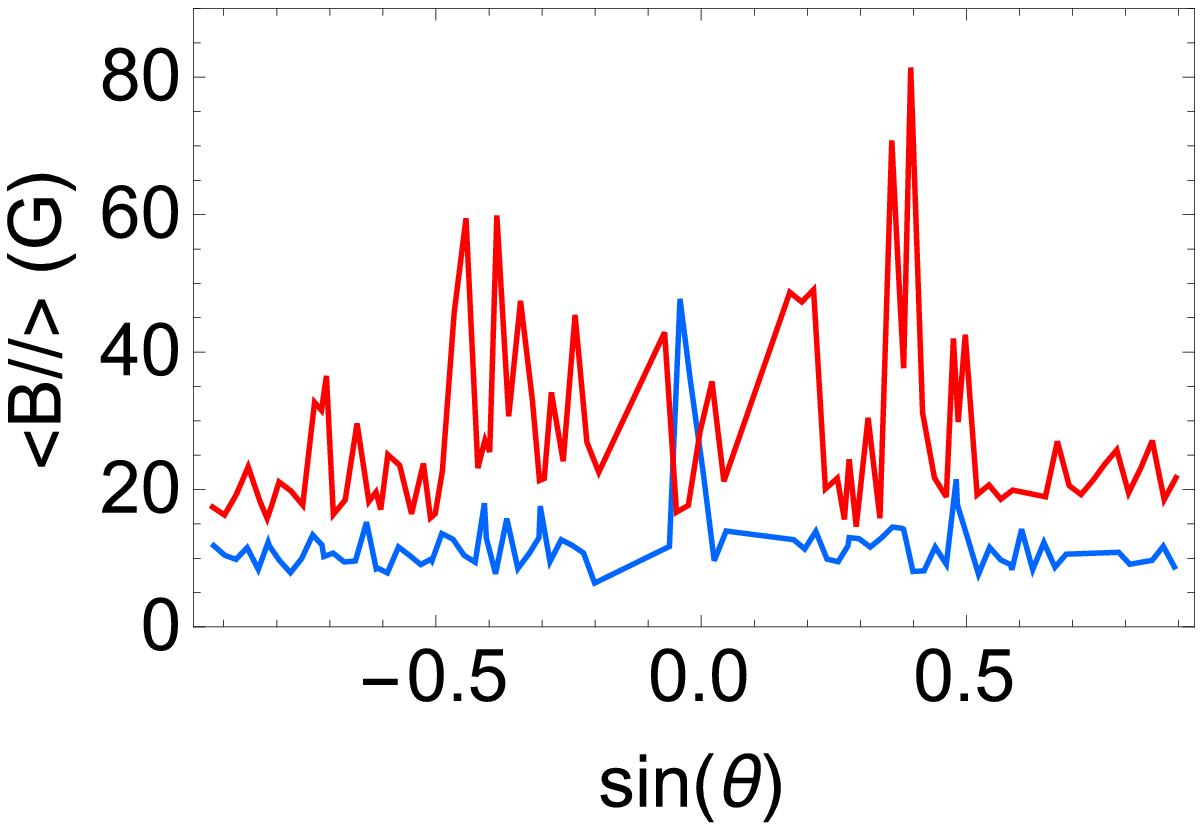
Average unsigned magnetic flux per pixel in 20″ × 20″ regions located along the north-south polar axis as a function of the sinus of the latitude. Negative values of sinθ refer to the southern hemisphere. Red curve: 2013 data, blue curve: 2007 data.
Current usage metrics show cumulative count of Article Views (full-text article views including HTML views, PDF and ePub downloads, according to the available data) and Abstracts Views on Vision4Press platform.
Data correspond to usage on the plateform after 2015. The current usage metrics is available 48-96 hours after online publication and is updated daily on week days.
Initial download of the metrics may take a while.