Fig. 3
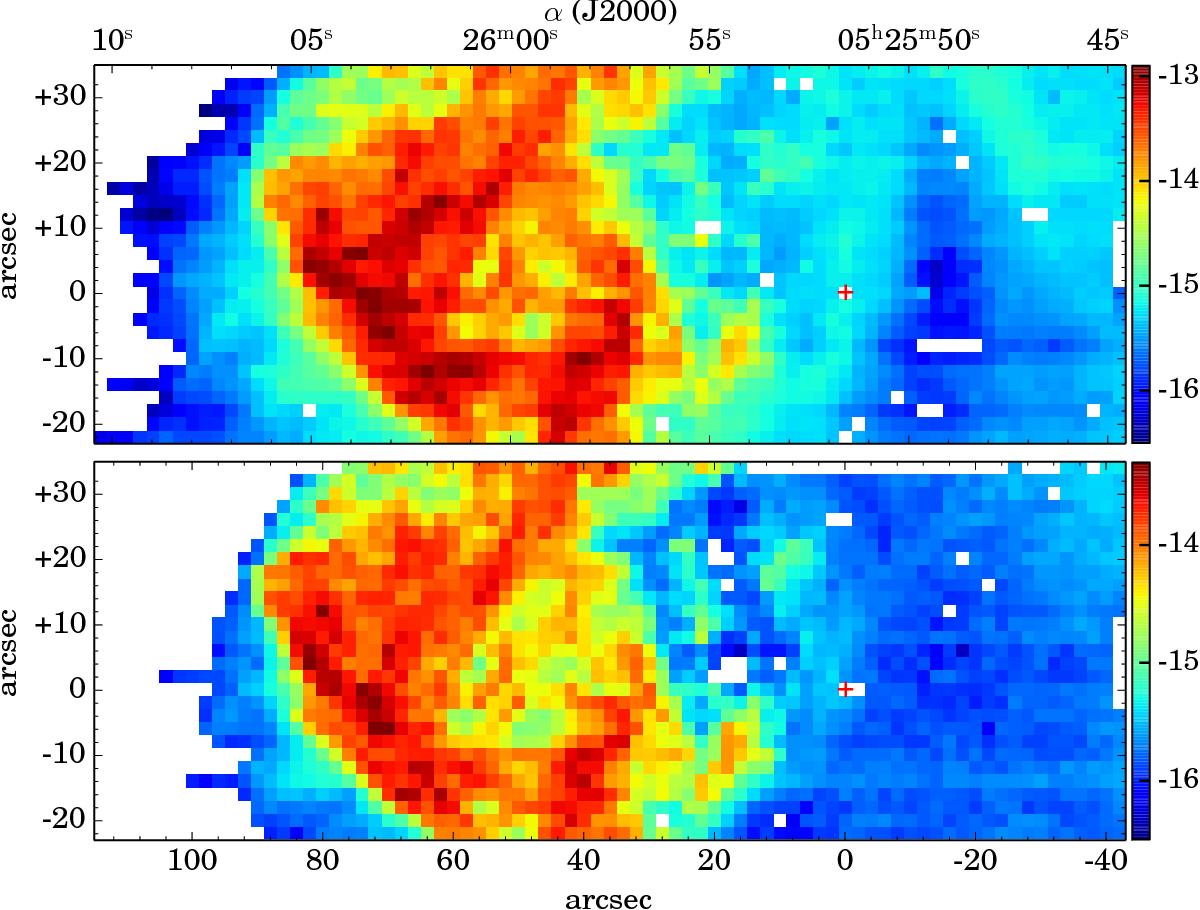
Maps of the observed Hα (top) and [O iii] λ5007 (bottom) fluxes (in logarithmic scale and in units of erg cm-2 s-1). The red cross marks the reference star position (α = 05h25m51.6s, δ = −66°05′05.5″; J2000). Axes indicate the offsets (in arcsec) of the reference star. North is at the top and east is to the left. Each pixel represents a 2″×2″ region on the plane of the sky.
Current usage metrics show cumulative count of Article Views (full-text article views including HTML views, PDF and ePub downloads, according to the available data) and Abstracts Views on Vision4Press platform.
Data correspond to usage on the plateform after 2015. The current usage metrics is available 48-96 hours after online publication and is updated daily on week days.
Initial download of the metrics may take a while.