Fig. 4
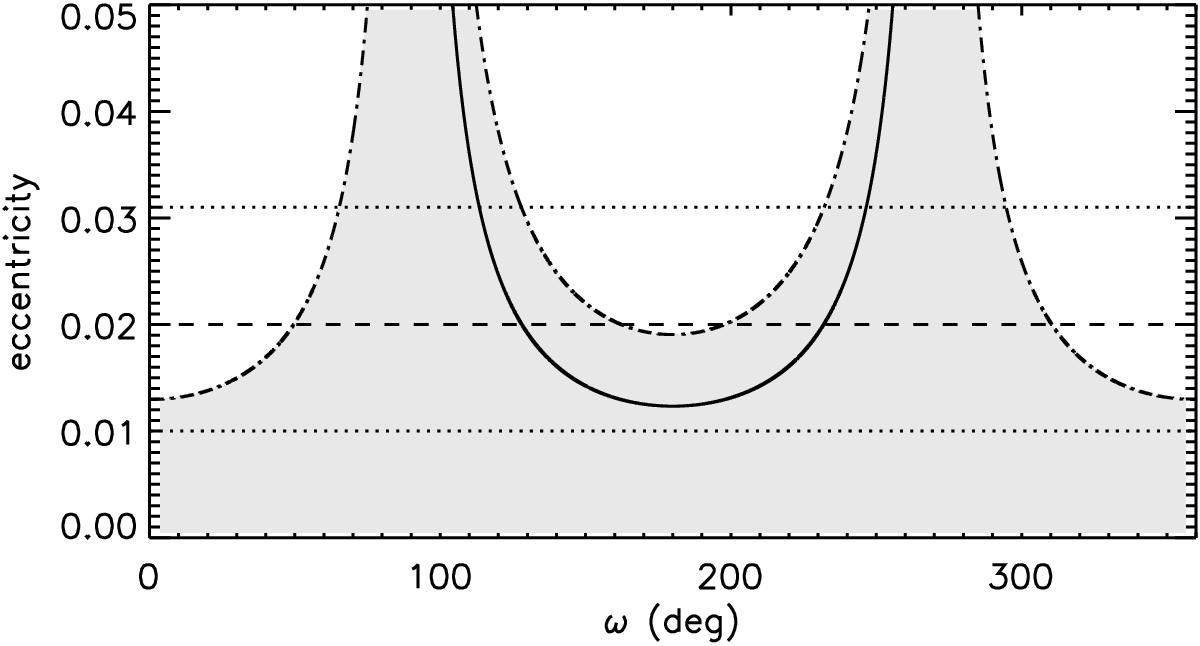
Distinct orbital configurations for ![]() , with the value ecosω = −0.0123 presented as a solid line. The lower and upper limits are shown as dash-dotted lines. The whole interval of −0.0190 ≤ ecosω ≤ 0.0129 is represented by the gray shaded area. The horizontal dotted lines show the eccentricity range found by Covino et al. (2013), with e = 0.02 presented as a dashed horizontal line.
, with the value ecosω = −0.0123 presented as a solid line. The lower and upper limits are shown as dash-dotted lines. The whole interval of −0.0190 ≤ ecosω ≤ 0.0129 is represented by the gray shaded area. The horizontal dotted lines show the eccentricity range found by Covino et al. (2013), with e = 0.02 presented as a dashed horizontal line.
Current usage metrics show cumulative count of Article Views (full-text article views including HTML views, PDF and ePub downloads, according to the available data) and Abstracts Views on Vision4Press platform.
Data correspond to usage on the plateform after 2015. The current usage metrics is available 48-96 hours after online publication and is updated daily on week days.
Initial download of the metrics may take a while.