Fig. 3
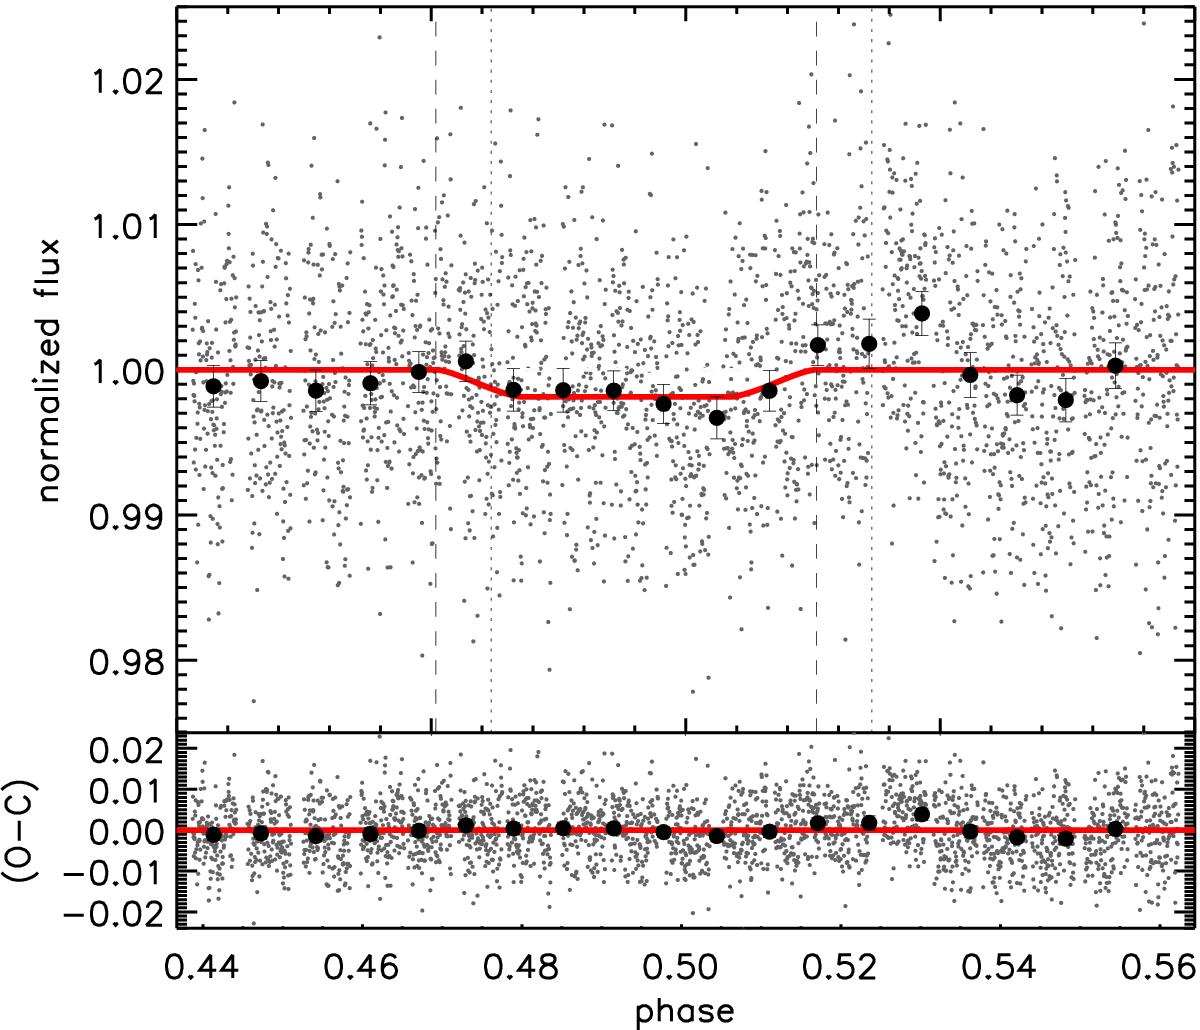
Secondary eclipse of Qatar-1b in the Ks band, showing the best-fitting model with ΔF = 0.186%, and Δφ = −0.0071. The detrended light curve is presented, where the small dots show the individual measurements. The solid line represents the best occultation model obtained from the joint-MCMC analysis, after removing the contribution of the systematics. The dotted vertical lines show the ingress and egress positions expected for circular orbit, and the dashed lines present ingress and egress found in the analysis. The filled circles show the light curve binned every 143 points (~9.5 min), for better visualization.
Current usage metrics show cumulative count of Article Views (full-text article views including HTML views, PDF and ePub downloads, according to the available data) and Abstracts Views on Vision4Press platform.
Data correspond to usage on the plateform after 2015. The current usage metrics is available 48-96 hours after online publication and is updated daily on week days.
Initial download of the metrics may take a while.