Fig. 9
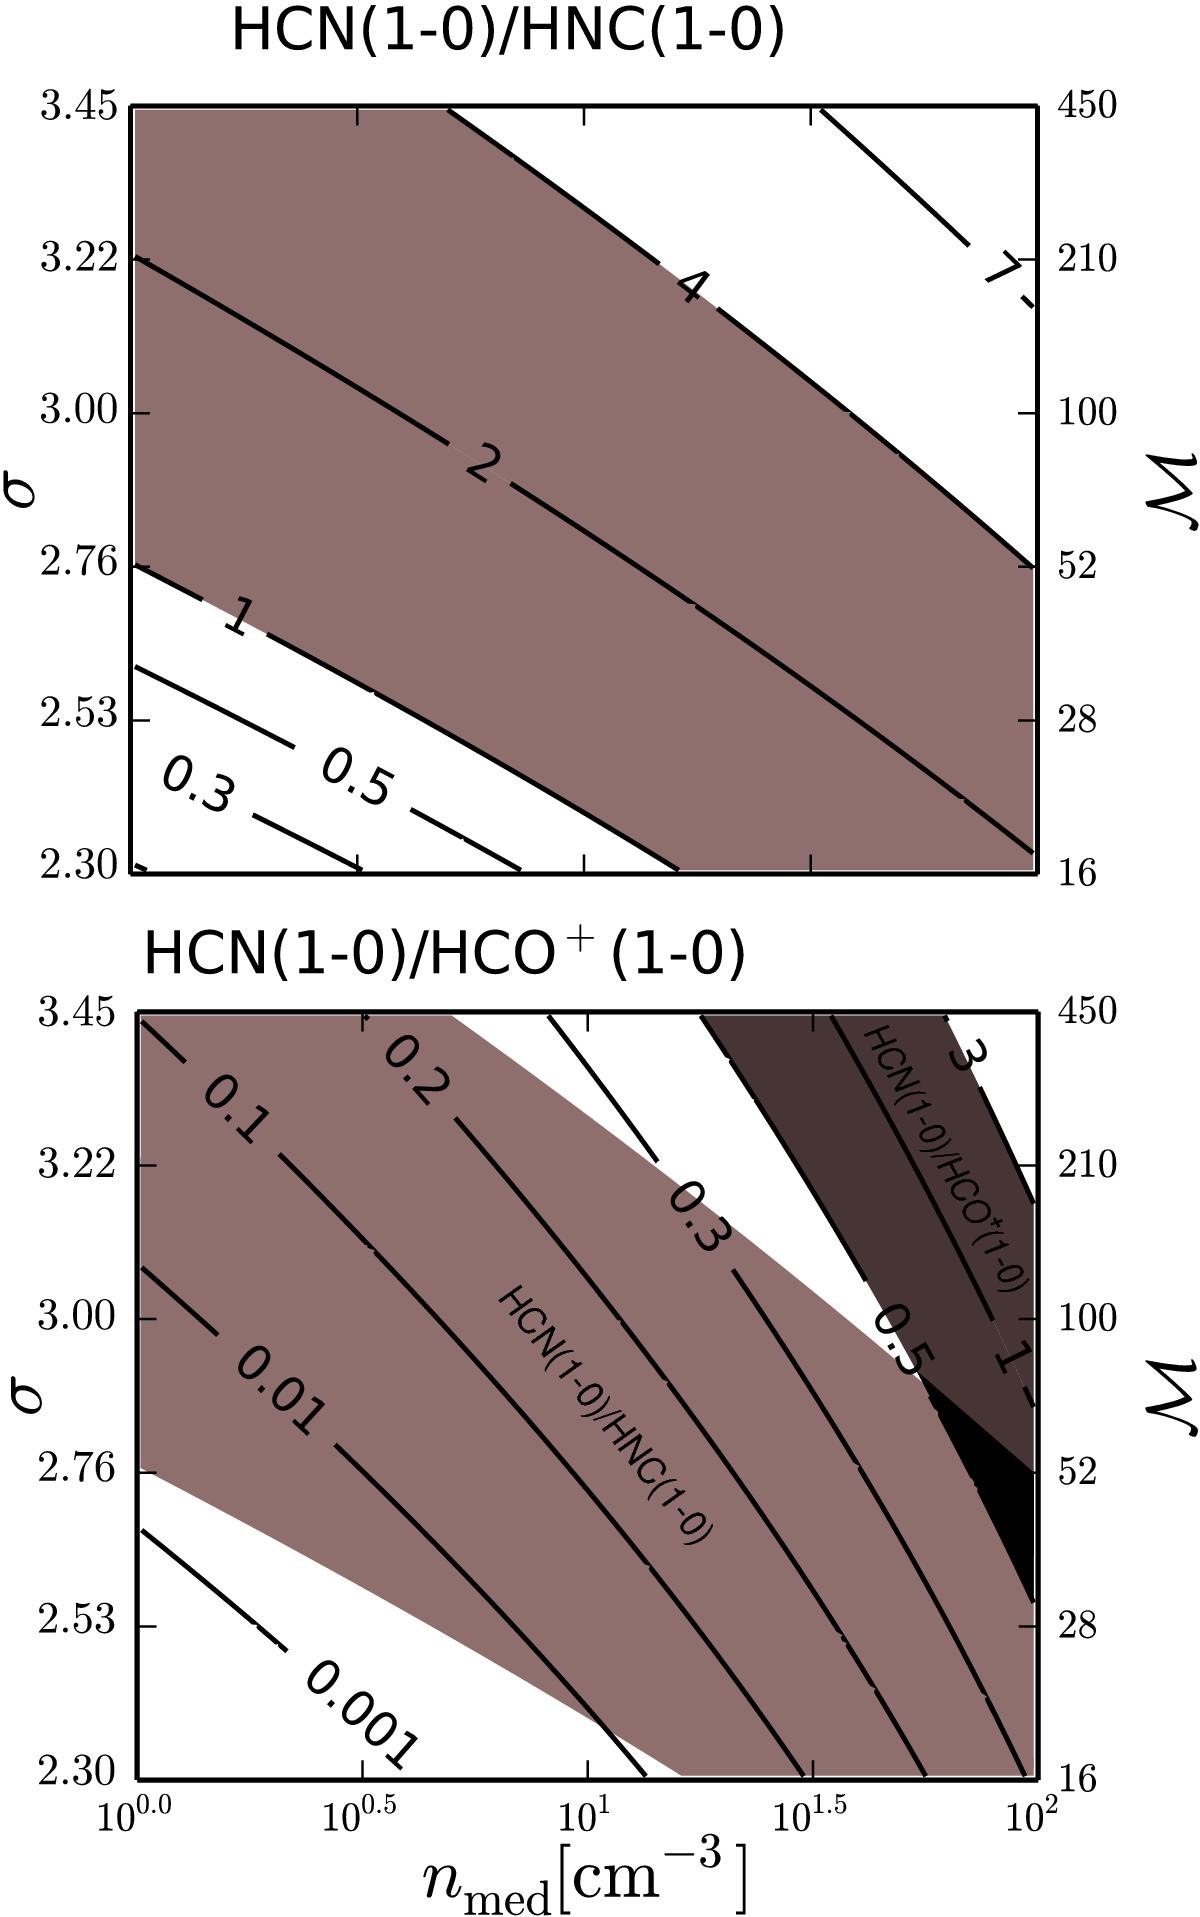
Top: line ratios of HNC(1−0)/HCN(1−0) as a function of the mean and the dispersion of the PDF. Bottom: line ratios of HCO+ (1−0)/HCN(1−0) as a function of the mean and the dispersion of the PDF. The dark brown stripe represents observational data. The overlapping region of these two line ratios is colored in black in the bottom panel. For all the grid points a typical AV = 10 mag and Γmech = 10-22 cm-3 is used. In both panels, Mach numbers are reported on the right axes and G is 100.
Current usage metrics show cumulative count of Article Views (full-text article views including HTML views, PDF and ePub downloads, according to the available data) and Abstracts Views on Vision4Press platform.
Data correspond to usage on the plateform after 2015. The current usage metrics is available 48-96 hours after online publication and is updated daily on week days.
Initial download of the metrics may take a while.