Fig. 7
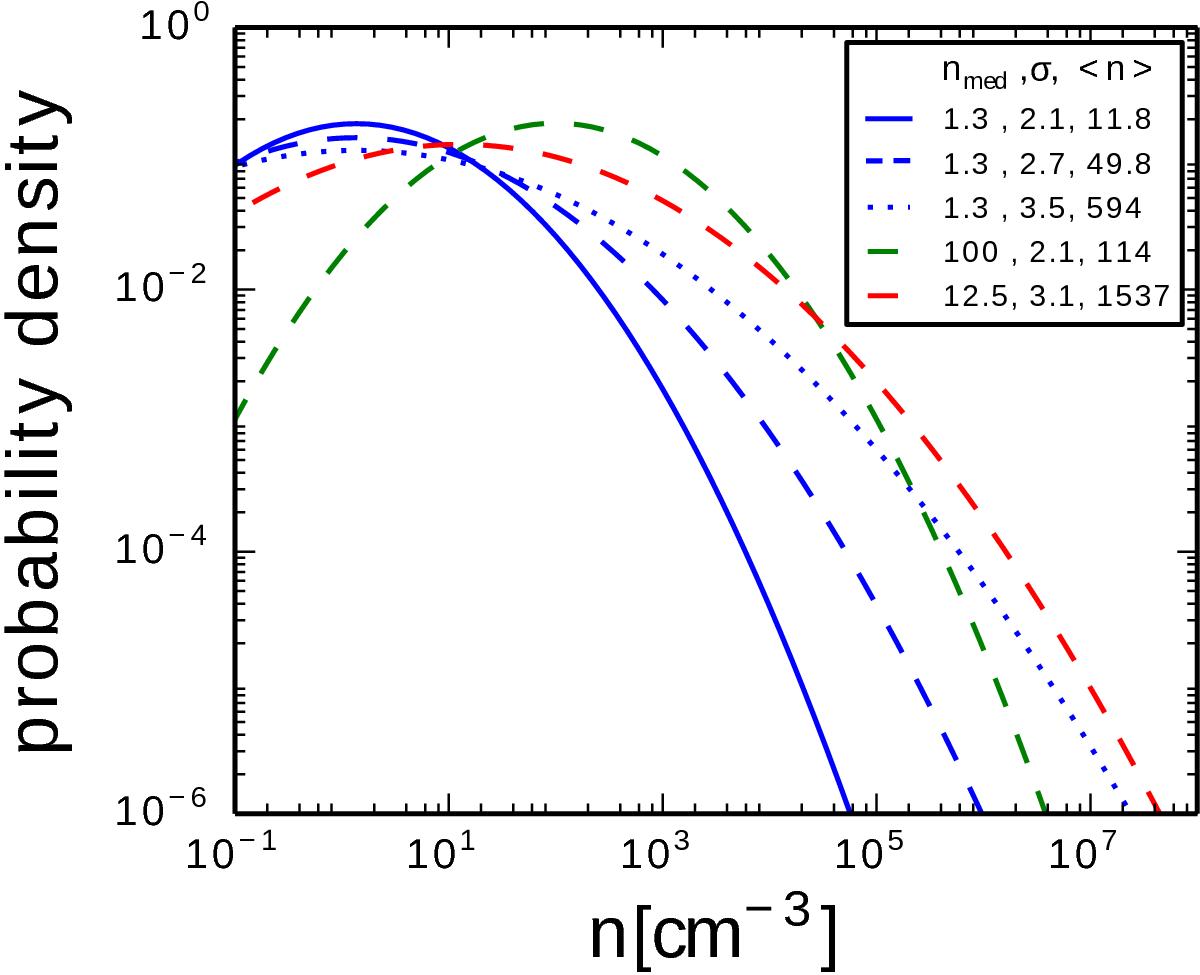
Effect of varying the median and the dispersion of a density PDFs. The blue curves represent PDFs that have the same median density as the one used in SPH simulation, but with increasing dispersions. The green curve has the same dispersion as that of the SPH simulation but with a higher median density. Finally, the red curve corresponds to the density PDF by Wada (2001). The mean densities corresponding to these PDFs are also listed in the legend.
Current usage metrics show cumulative count of Article Views (full-text article views including HTML views, PDF and ePub downloads, according to the available data) and Abstracts Views on Vision4Press platform.
Data correspond to usage on the plateform after 2015. The current usage metrics is available 48-96 hours after online publication and is updated daily on week days.
Initial download of the metrics may take a while.