Fig. 5
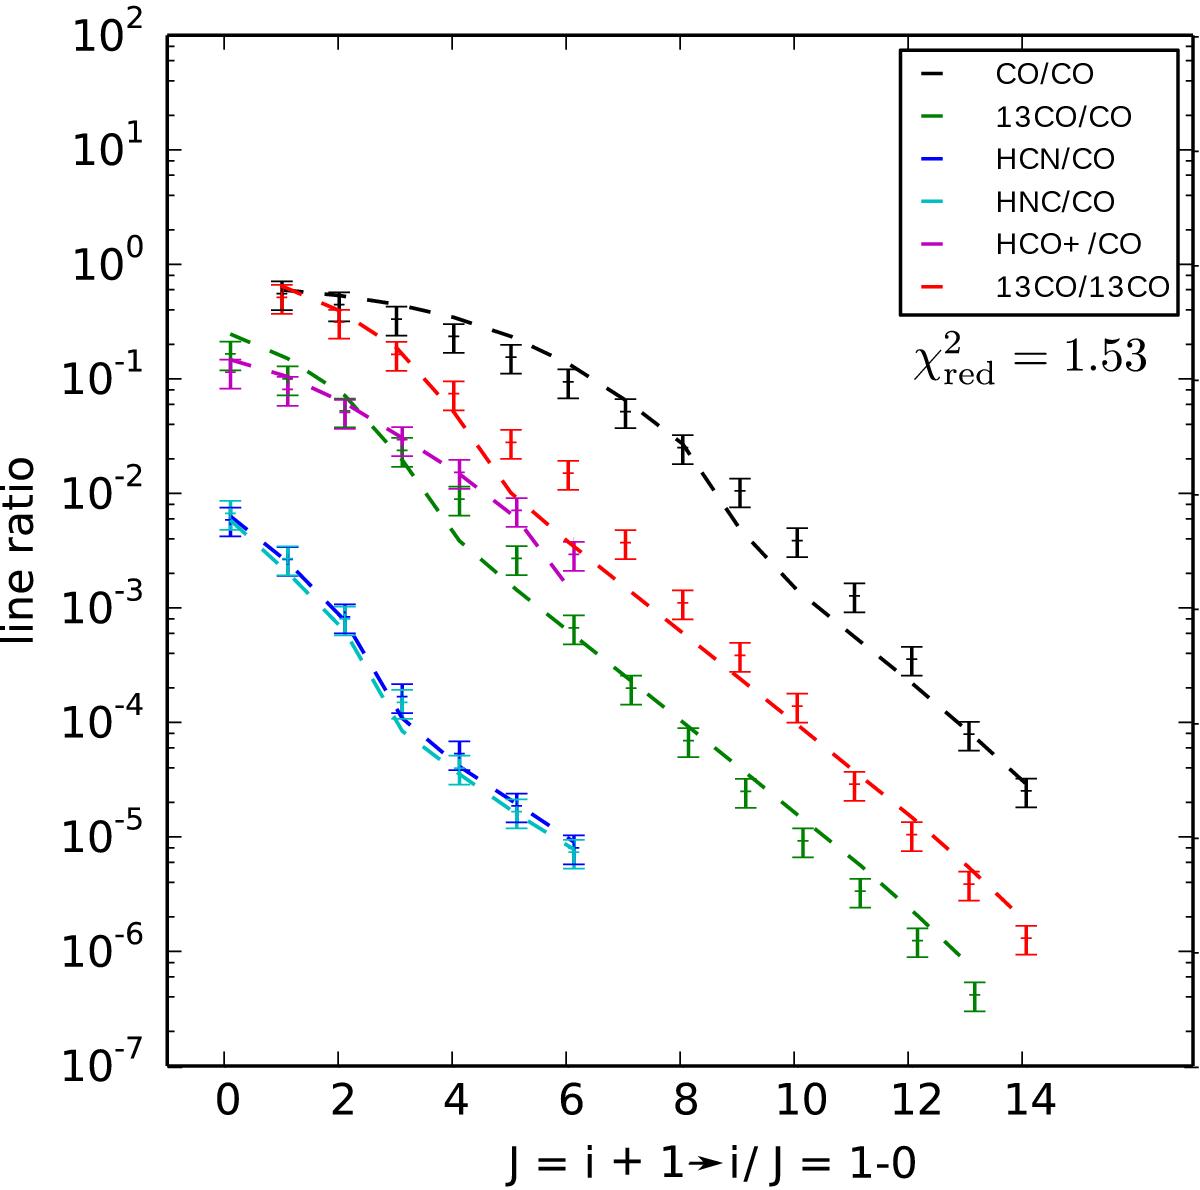
Sample fit of the line ratios of the central pixel (0.4 × 0.4 kpc2) with a single PDR model. The points with error bars represent the line ratios of the specified species from the synthetic maps. The dashed curves correspond to the line ratios of the best fit PDR model. All the ratios are normalized to CO(1−0) except for the red ratios which are normalized to 13CO (1−0).
Current usage metrics show cumulative count of Article Views (full-text article views including HTML views, PDF and ePub downloads, according to the available data) and Abstracts Views on Vision4Press platform.
Data correspond to usage on the plateform after 2015. The current usage metrics is available 48-96 hours after online publication and is updated daily on week days.
Initial download of the metrics may take a while.