Fig. 2
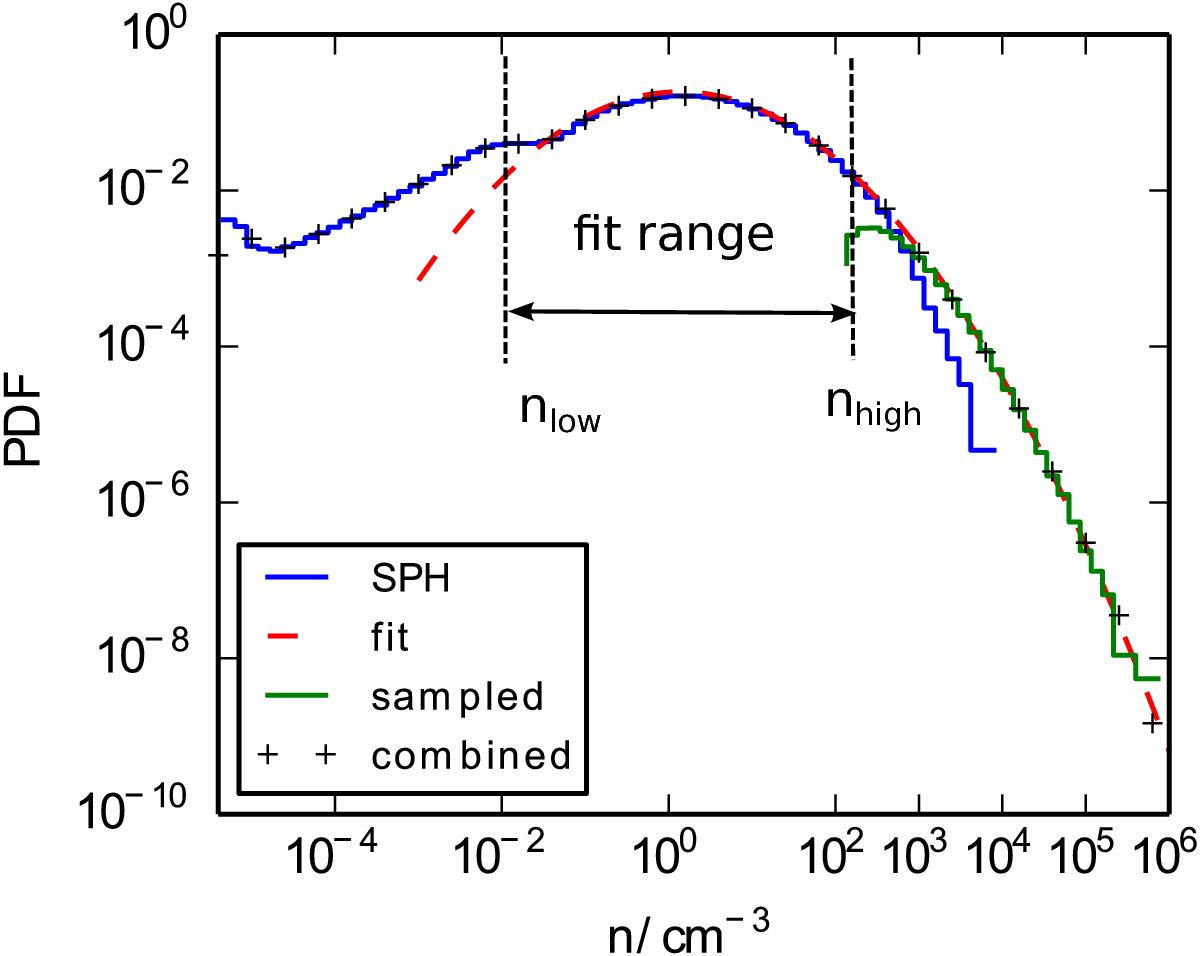
Probability density function of the SPH particles. The blue curve corresponds to the PDF of gas density n and it is proportional to dN/ dlog (n); in other words this curve represents the probability of finding an SPH particle within a certain interval of log (n). The dashed-red curve is the log-normal fit of the PDF of the blue curve in the range 10-2 to 102. The green curve is the PDF of the sampled population from the original SPH particles while keeping the samples with n> 102 cm-3. The black crosses trace the combined PDF of the sampled and the original set of the SPH particles. The median density and the dispersion are nmed = 1.3 cm-3 and σ = 2.1 respectively.
Current usage metrics show cumulative count of Article Views (full-text article views including HTML views, PDF and ePub downloads, according to the available data) and Abstracts Views on Vision4Press platform.
Data correspond to usage on the plateform after 2015. The current usage metrics is available 48-96 hours after online publication and is updated daily on week days.
Initial download of the metrics may take a while.