Free Access
Fig. A.1
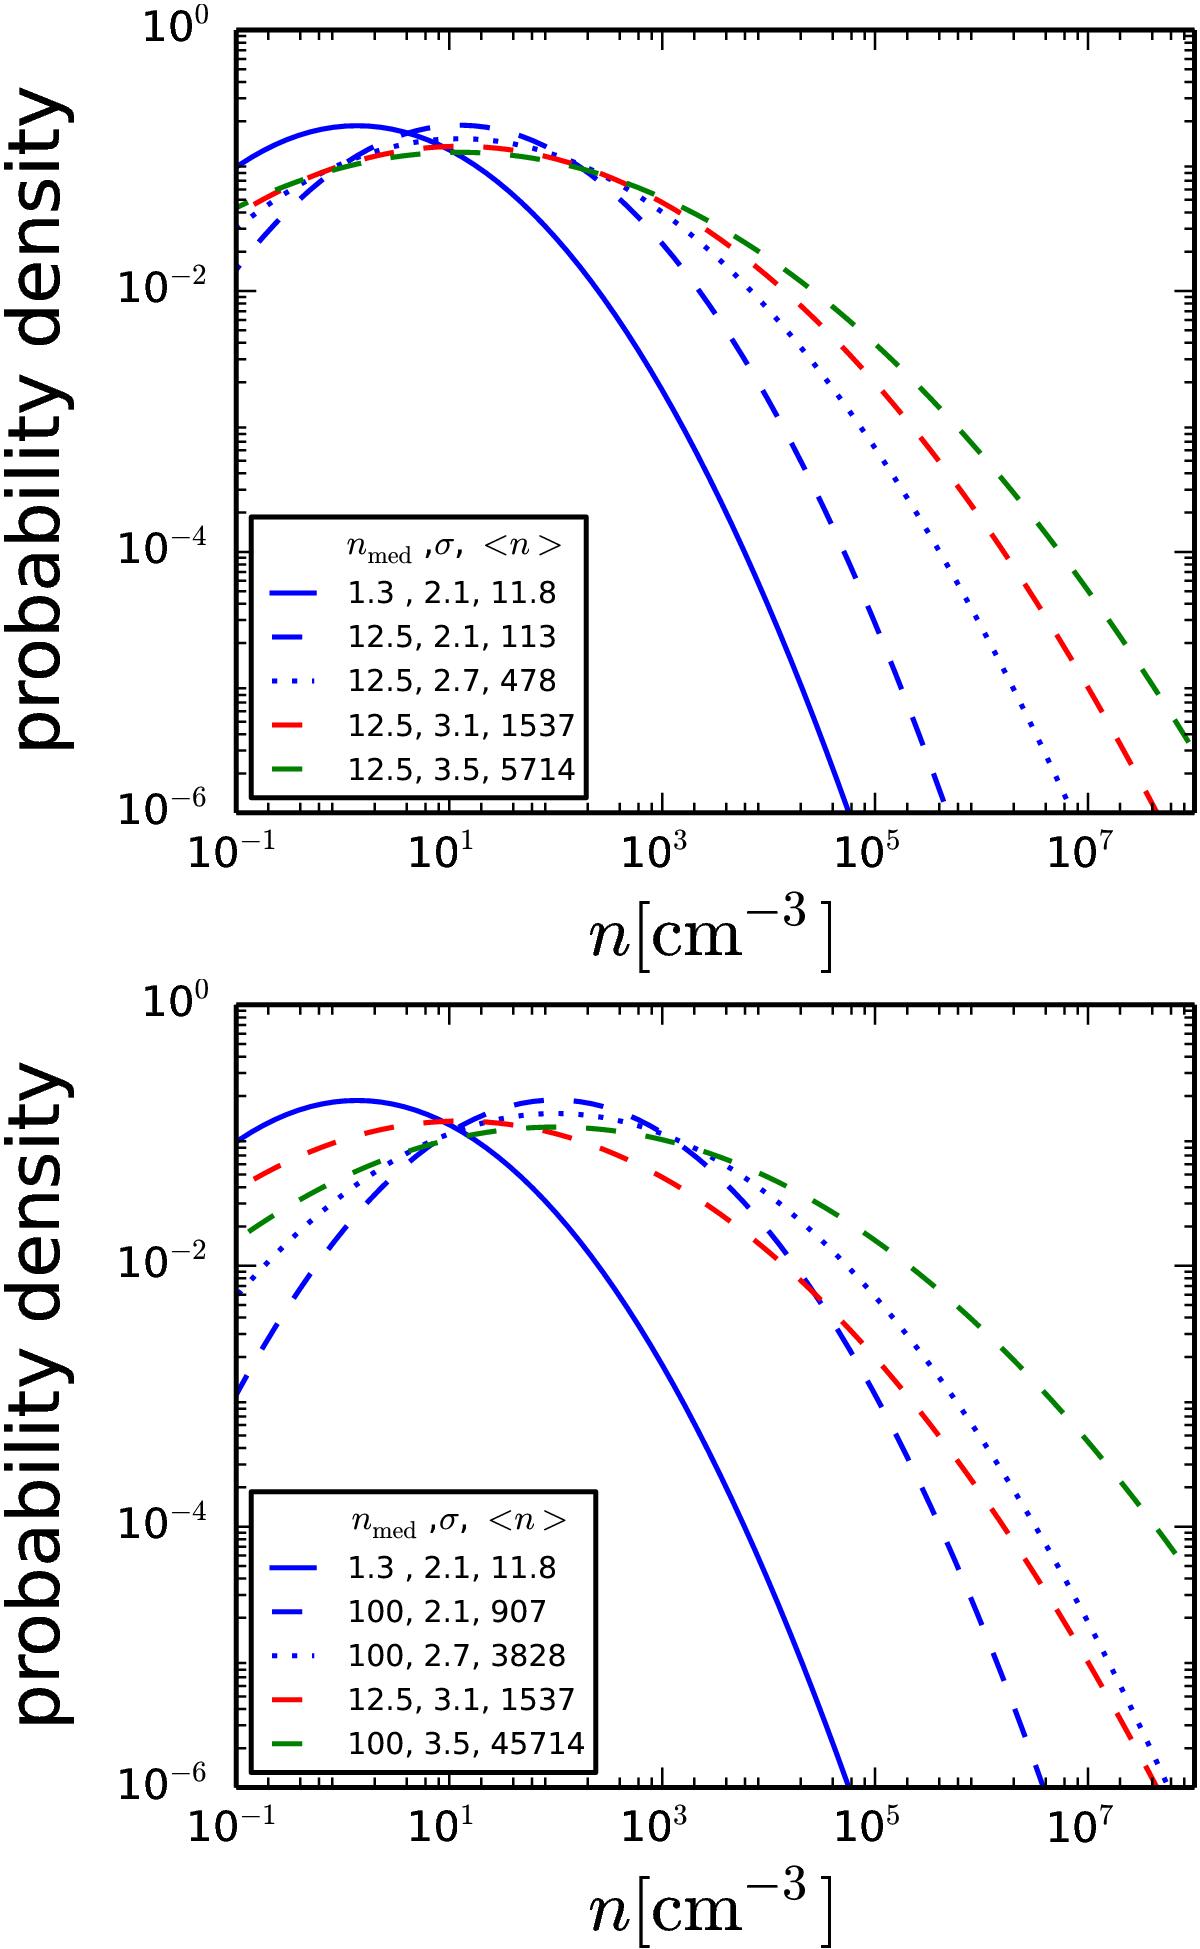
Analogous to Fig. 7 where the dispersion is varied for a fixed median density of 12.5 cm-3 in the top panel and 100 cm-3 in the bottom panel. In both cases the density PDF of the SPH simulation and the Wada 2001 simulation are also shown for reference and comparison.
This figure is made of several images, please see below:
Current usage metrics show cumulative count of Article Views (full-text article views including HTML views, PDF and ePub downloads, according to the available data) and Abstracts Views on Vision4Press platform.
Data correspond to usage on the plateform after 2015. The current usage metrics is available 48-96 hours after online publication and is updated daily on week days.
Initial download of the metrics may take a while.