Fig. 1
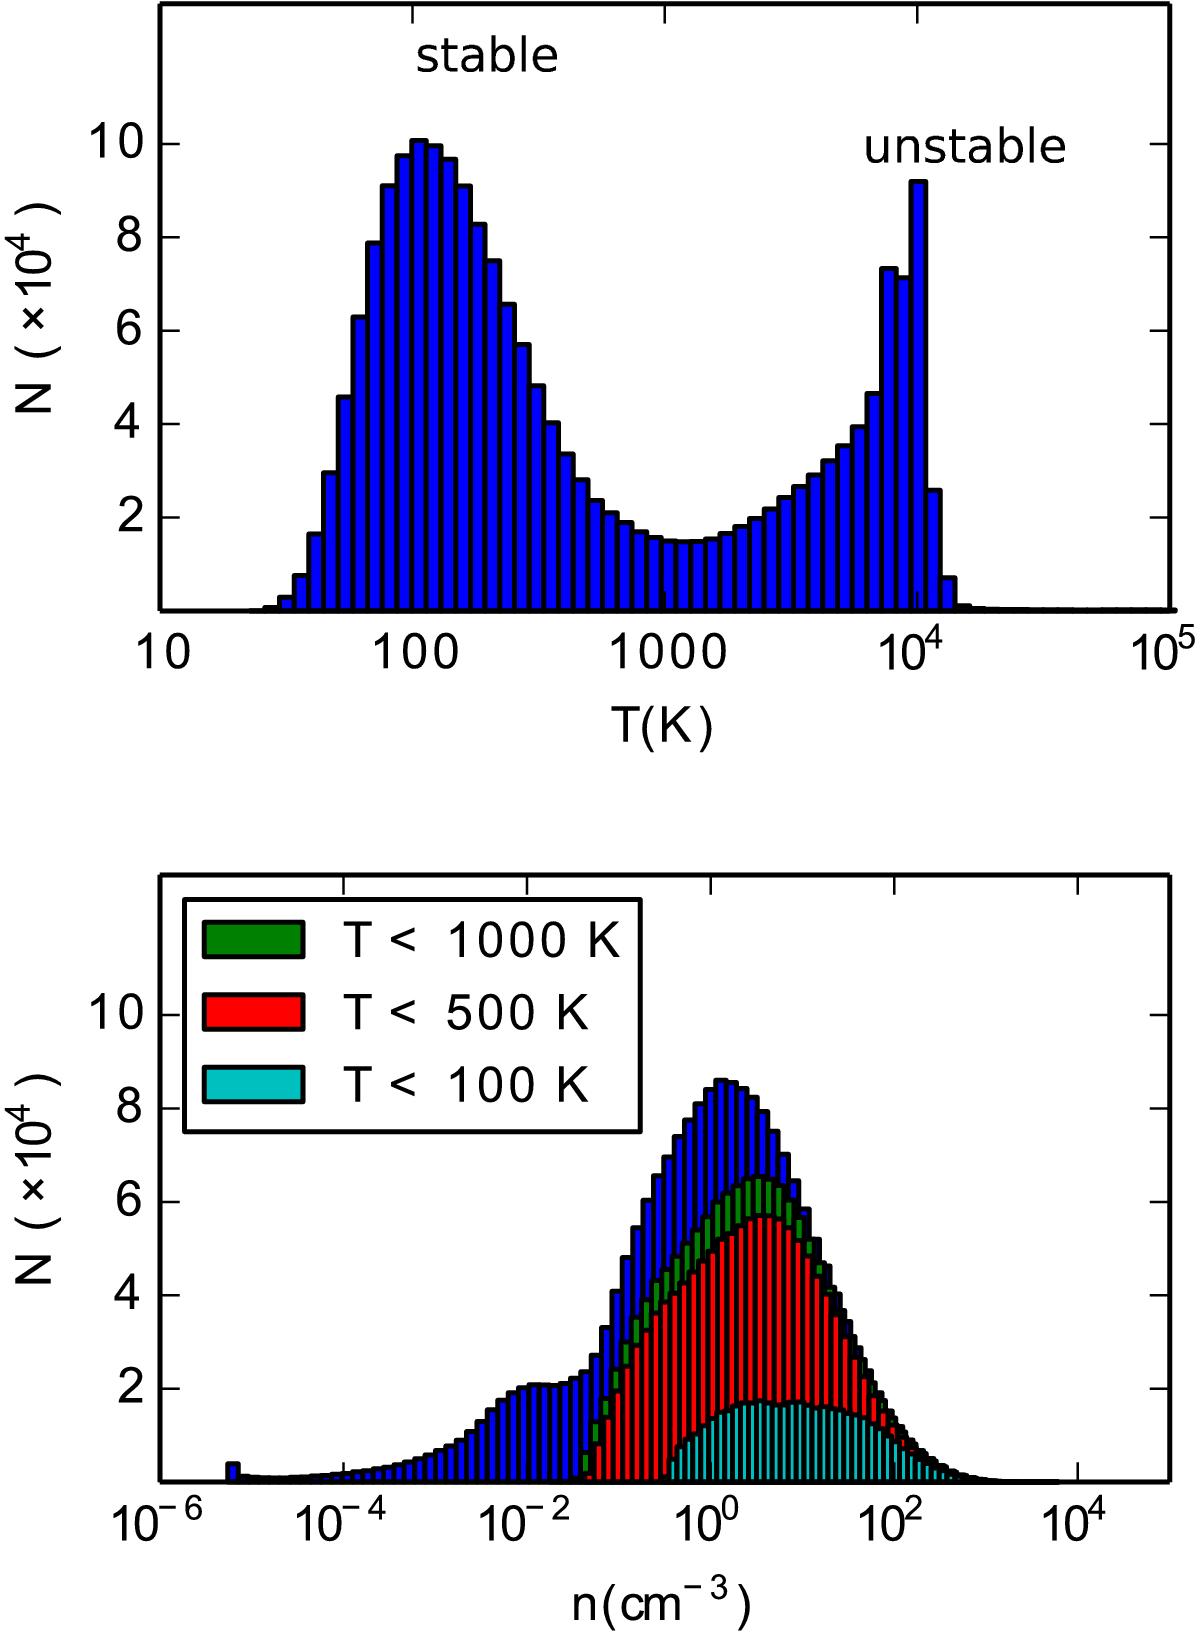
Top: histogram of the kinetic temperature of the SPH particles. Bottom: histogram of the gas density of the SPH particles. In this same panel, the histograms for the gas densities of sub-populations of the gas are also shown. The red, green and cyan histograms correspond to gas particles with temperature below T = 1000,500,100 K respectively. These sub-populations of the gas particles are thermally stable corresponding to the peak around T = 300 K in the top panel. The vertical axis refers to the number of SPH particles within each bin.
Current usage metrics show cumulative count of Article Views (full-text article views including HTML views, PDF and ePub downloads, according to the available data) and Abstracts Views on Vision4Press platform.
Data correspond to usage on the plateform after 2015. The current usage metrics is available 48-96 hours after online publication and is updated daily on week days.
Initial download of the metrics may take a while.