| Issue |
A&A
Volume 595, November 2016
|
|
|---|---|---|
| Article Number | C2 | |
| Number of page(s) | 3 | |
| Section | Stellar structure and evolution | |
| DOI | https://doi.org/10.1051/0004-6361/201323317e | |
| Published online | 09 November 2016 | |
Oscillation mode linewidths and heights of 23 main-sequence stars observed by Kepler (Corrigendum)
1 Univ. Paris-Sud, Institut d’Astrophysique Spatiale, UMR 8617, CNRS, Bâtiment 121, 91405 Orsay Cedex, France
e-mail: This email address is being protected from spambots. You need JavaScript enabled to view it.
2 Tata Institute of Fundamental Research, Homi Bhabha Road, 400005 Mumbai, India
3 Sydney Institute for Astronomy (SIfA), School of Physics, University of Sydney, New South Wales 2006, Australia
4 Department of Astronomy, The University of Tokyo, Tokyo 113-033, Japan
5 School of Physics and Astronomy, University of Birmingham, Edgbaston, Birmingham B15 2TT, UK
6 Instituto de Astrofísica de Canarias, 38205 La Laguna, Tenerife, Spain
7 Universidad de La Laguna, Dpto. de Astrofísica, 38206 La Laguna, Tenerife, Spain
8 LESIA, Observatoire de Paris, CNRS UMR 8109, UPMC, Université Denis Diderot, 5 place Jules Janssen, 92195 Meudon Cedex, France
9 Stellar Astrophysics Centre, Department of Physics and Astronomy, Aarhus University, 8000 Aarhus C, Denmark
10 Laboratoire AIM, CEA/DSM-CNRS-Université Paris Diderot, IRFU/SAp, Centre de Saclay, 91191 Gif-sur-Yvette Cedex, France
Key words: stars: interiors / asteroseismology / methods: data analysis / errata, addenda
In Appourchaux et al. (2014), the correct Eq. (1) should have been written with a minus sign in front of the second bracket as 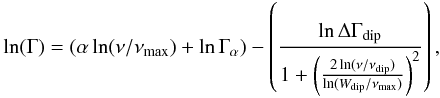 (1)where ν is the mode frequency, νmax is the frequency of maximum mode height, α is the power law index, Γα is the factor of the power law, ΔΓdip is the depth of the dip, Wdip is the width of the dip and νdip is the frequency of the dip. The fits in Appourchaux et al. (2014) were indeed performed with the minus sign.
Another error was also found in the original Table 3 of Appourchaux et al. (2014) pretending to give the parameters of Eq. (1). As a matter of fact, in that Table 3, the parameter Wdip as reported is related to the full width at half maximum (FWHM) calculated in frequency space, and in addition wrongly computed as it should have been about 1.5 times larger. Using Eq. (1) given above, we can deduce the proper relation between FWHMdip and Wdip as 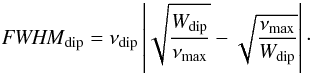 (2)
(2)
In Table 1, we give the parameters that were not affected by the mistake supplemented by the value of νdip which was not given in Appourchaux et al. (2014). In Table 2, we give the parameter Wdip that was not properly given in the Table 3 of Appourchaux et al. (2014), together with the corrected FWHMdip, a value which was not correct in Table 3 of Appourchaux et al. (2014) and was wrongly named. We also note that from the expression of Eq. (1), there are two solutions for Wdip since we have 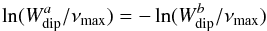 (3)where
  is the solution greater than νmax, while
  is the solution smaller than νmax. Here the solution chosen for Wdip is the former solution.
These corrections do not affect the conclusions reached for the dependence of these parameters upon the effective temperature and νmax.
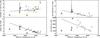 |
Fig. 6 Parameters of Eq. (1) as a function of the effective temperature for all 28 stars, for the power law dependence (left) and for the Lorentzian fit (right). The median value together with the credible intervals at 33% and 66% were derived from a Monte-Carlo simulation of the fit. The orange line shows the temperature dependence of the linewidth at the frequency of maximum mode height as derived by Appourchaux et al. (2012). The open diamond is the result of the fit for the solar data of the LOI. The open triangles are the results of the fit for the sub-giant stars of Benomar et al. (2013). The solid lines show a linear fit of the parameters with respect to the effective temperature. The Lorentzian parameters for stars for which the Lorentzian fit is not significant are not plotted. |
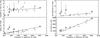 |
Fig. 7 Parameters of Eq. (1) as a function of the frequency of maximum mode height for all 28 stars, for the power law dependence (left) and for the Lorentzian fit (right). The median value together with the credible intervals of 33% and 66% were derived from a Monte-Carlo simulation of the fit. The open diamond is the result of the fit for the solar LOI data. The open triangles are the result of the fit for the sub-giant stars of Benomar et al. (2013). The error bars are derived from a Monte-Carlo simulation using credible intervals of 33% and 66%. The solid lines show a linear fit of the parameters with respect to the frequency. The Lorentzian parameters for stars for which the Lorentzian fit is not significant are not plotted. |
Linewidth parameters as per Eq. (1).
Width of the linewidth (Wdip) as per Eq. (1) and of FWHMdip as per Eq. (2).
Acknowledgments
We are grateful to Mikkel N. Lund for having found a discrepancy leading to the main author to find the source of the mistake.
References
- Appourchaux, T., Benomar, O., Gruberbauer, M., et al. 2012, A&A, 537, A134 [NASA ADS] [CrossRef] [EDP Sciences] [Google Scholar]
- Appourchaux, T., Antia, H. M., Benomar, O., et al. 2014, A&A, 566, A20 [NASA ADS] [CrossRef] [EDP Sciences] [Google Scholar]
- Benomar, O., Bedding, T. R., Mosser, B., et al. 2013, ApJ, 767, 158 [NASA ADS] [CrossRef] [Google Scholar]
© ESO, 2016
All Tables
All Figures
|
Fig. 6 Parameters of Eq. (1) as a function of the effective temperature for all 28 stars, for the power law dependence (left) and for the Lorentzian fit (right). The median value together with the credible intervals at 33% and 66% were derived from a Monte-Carlo simulation of the fit. The orange line shows the temperature dependence of the linewidth at the frequency of maximum mode height as derived by Appourchaux et al. (2012). The open diamond is the result of the fit for the solar data of the LOI. The open triangles are the results of the fit for the sub-giant stars of Benomar et al. (2013). The solid lines show a linear fit of the parameters with respect to the effective temperature. The Lorentzian parameters for stars for which the Lorentzian fit is not significant are not plotted. |
| In the text | |
|
Fig. 7 Parameters of Eq. (1) as a function of the frequency of maximum mode height for all 28 stars, for the power law dependence (left) and for the Lorentzian fit (right). The median value together with the credible intervals of 33% and 66% were derived from a Monte-Carlo simulation of the fit. The open diamond is the result of the fit for the solar LOI data. The open triangles are the result of the fit for the sub-giant stars of Benomar et al. (2013). The error bars are derived from a Monte-Carlo simulation using credible intervals of 33% and 66%. The solid lines show a linear fit of the parameters with respect to the frequency. The Lorentzian parameters for stars for which the Lorentzian fit is not significant are not plotted. |
| In the text | |
Current usage metrics show cumulative count of Article Views (full-text article views including HTML views, PDF and ePub downloads, according to the available data) and Abstracts Views on Vision4Press platform.
Data correspond to usage on the plateform after 2015. The current usage metrics is available 48-96 hours after online publication and is updated daily on week days.
Initial download of the metrics may take a while.