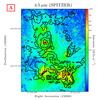
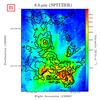
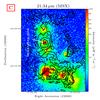
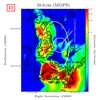
Fig. 4
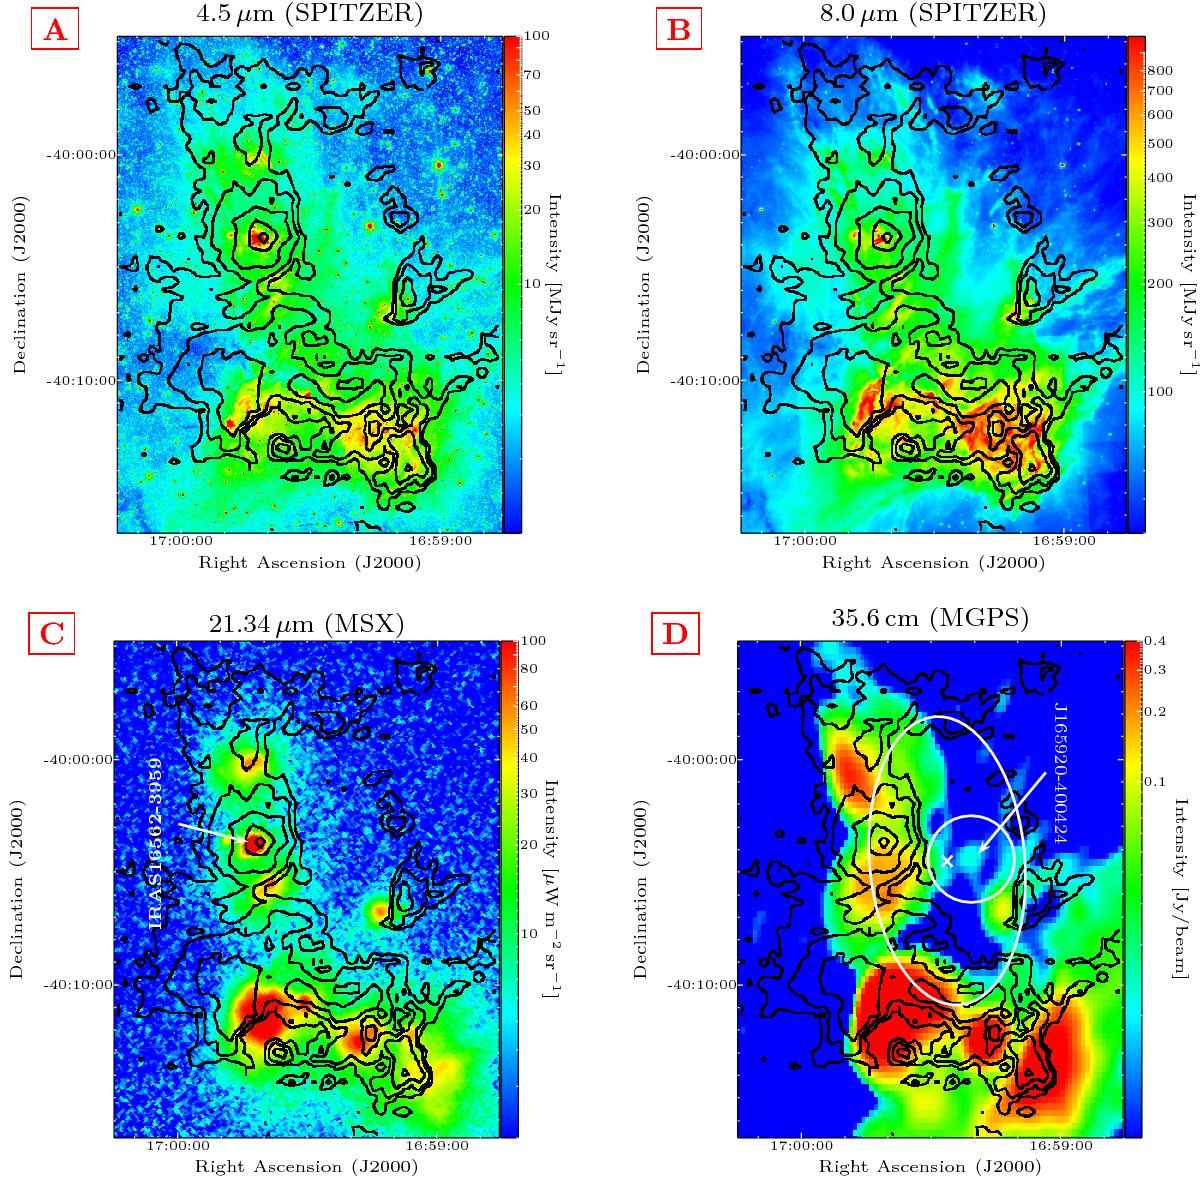
Images of radio and infrared continuum emission toward the ring G345.50+1.50, overlaid with contours of the 13CO(3−2) line integrated between −30 and −2 km s-1 (levels: 9, 18, 36, 72, and 144 K km s-1). Panels A) and B): 4.5 and 8.0 μm images from Spitzer. Panel C): 21.34 μm image from MSX. Panel D): 35.6 cm image from MGPS (Murphy et al. 2007). The arrow indicates the position of the 35.6 cm source J165920-400424, and the 2′ white circle shows the area where objects were searched for in the NED database to determine the nature of this source. The ellipse indicates the expanding ring model in the X–Y plane, with its center indicated with an X, see Sect. 3.11.
Current usage metrics show cumulative count of Article Views (full-text article views including HTML views, PDF and ePub downloads, according to the available data) and Abstracts Views on Vision4Press platform.
Data correspond to usage on the plateform after 2015. The current usage metrics is available 48-96 hours after online publication and is updated daily on week days.
Initial download of the metrics may take a while.