Fig. 11
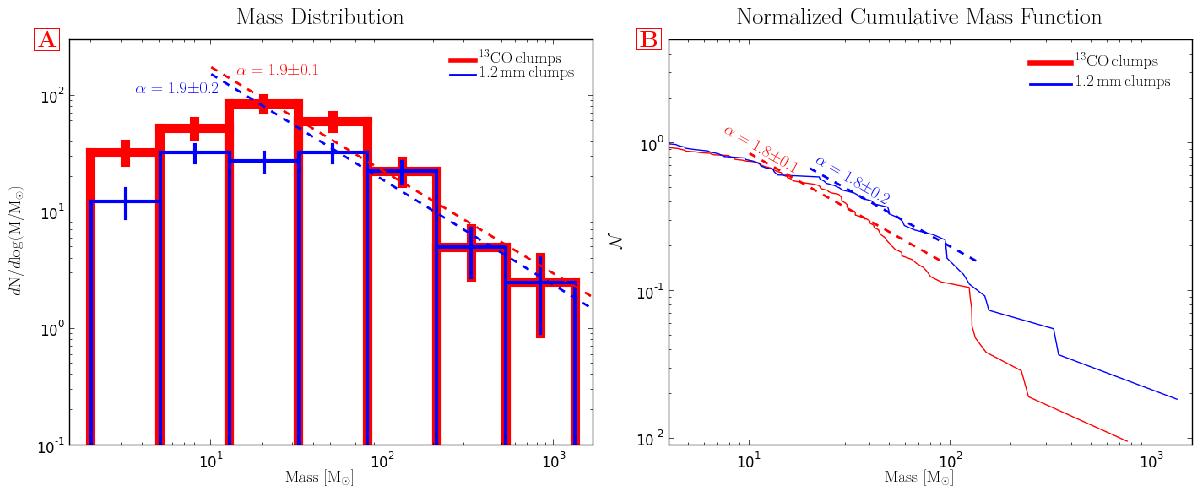
Panel A) histogram of the mass distributions for the 13CO clumps (solid red lines) and 1.2 mm clumps (solid blue lines). The dashed lines indicate the fits with α = 1.9 ± 0.1 for 13CO clumps and α = 1.9 ± 0.2 for 1.2 mm clumps. Panel B) normalized cumulative mass functions for the 13CO clumps (solid red lines) and 1.2 mm clumps (solid blue lines). The dashed lines indicate the fits with α = 1.8 ± 0.1 for 13CO clumps and α = 1.8 ± 0.2 for 1.2 mm clumps.
Current usage metrics show cumulative count of Article Views (full-text article views including HTML views, PDF and ePub downloads, according to the available data) and Abstracts Views on Vision4Press platform.
Data correspond to usage on the plateform after 2015. The current usage metrics is available 48-96 hours after online publication and is updated daily on week days.
Initial download of the metrics may take a while.