Fig. 5
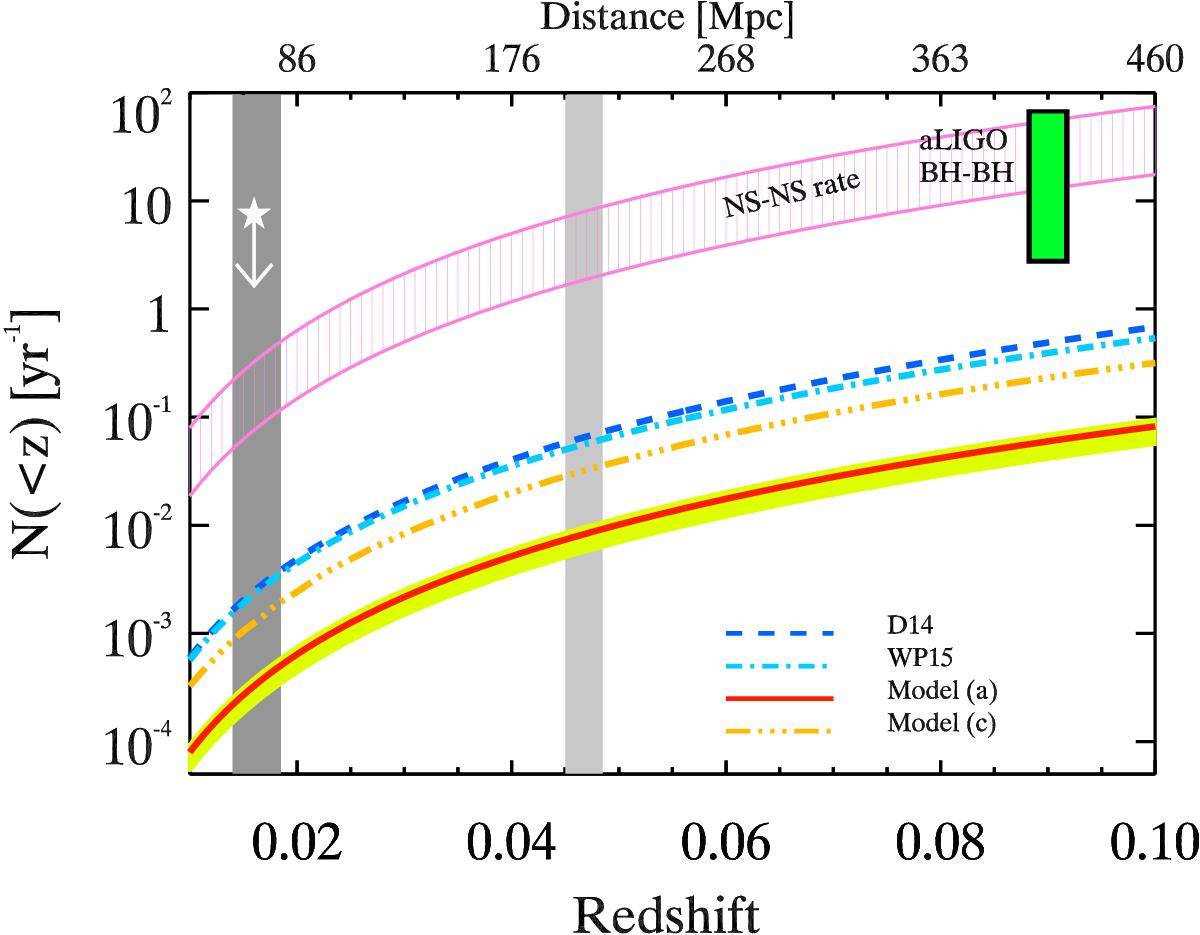
Event rates within redshift z: Solid red line and triple dot-dashed orange line represent the SGRB rates for case (a) and case (c) of this work, respectively. The yellow shaded region represents the 68% confidence level on the rate (red line) of case (a). SGRB rates according to the models of D14 and WP15 are shown by the dashed blue and dot-dashed cyan lines, respectively. The rate of NS−NS mergers is shown by the hatched pink region where the lower (upper) boundary corresponds to the rate derived from population synthesis models (Galactic binaries) in Dominik et al. (2015) and Kim et al. (2015). The vertical grey shaded regions show the present and design ranges of aLIGO for NS−NS mergers. The upper limit (white star) corresponds to the non-detection of NS−NS mergers in the first 48.6 days of the “O1” run of aLIGO. The green vertical bar is the rate of binary BH mergers derived by Abbott et al. (2016b) and shown here at the distance of GW150914 and GW151226.
Current usage metrics show cumulative count of Article Views (full-text article views including HTML views, PDF and ePub downloads, according to the available data) and Abstracts Views on Vision4Press platform.
Data correspond to usage on the plateform after 2015. The current usage metrics is available 48-96 hours after online publication and is updated daily on week days.
Initial download of the metrics may take a while.