Fig. 4
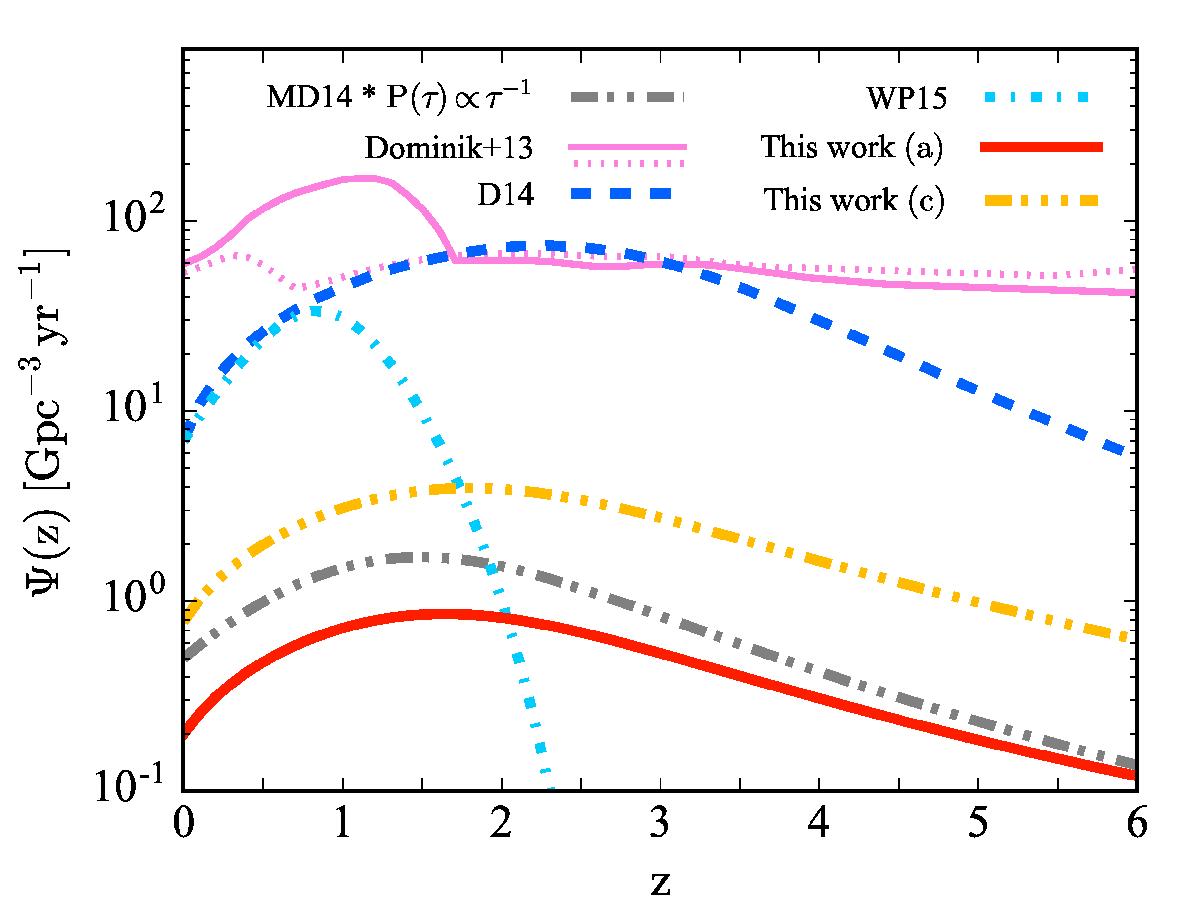
Comparison between various predicted SGRB redshift distributions. The grey dashed line represents the convolution of the MD14 cosmic SFH with a delay time distribution P(τ) ∝ τ-1 with τ> 20 Myr (the normalization is arbitrary). The pink solid line (pink dotted line) represents the redshift distribution of NS−NS binary mergers predicted by Dominik et al. (2013) in their high end (low end) metallicity evolution scenario (standard binary evolution model). The blue dashed line and cyan dot-dashed line are the SGRB redshift distributions according to D14 and to WP15, respectively. The red solid line is our result in case (a), while the orange triple dot-dashed line is our result in case (c). In both cases we used the mean parameter values as listed in Table 1.
Current usage metrics show cumulative count of Article Views (full-text article views including HTML views, PDF and ePub downloads, according to the available data) and Abstracts Views on Vision4Press platform.
Data correspond to usage on the plateform after 2015. The current usage metrics is available 48-96 hours after online publication and is updated daily on week days.
Initial download of the metrics may take a while.