Fig. 1
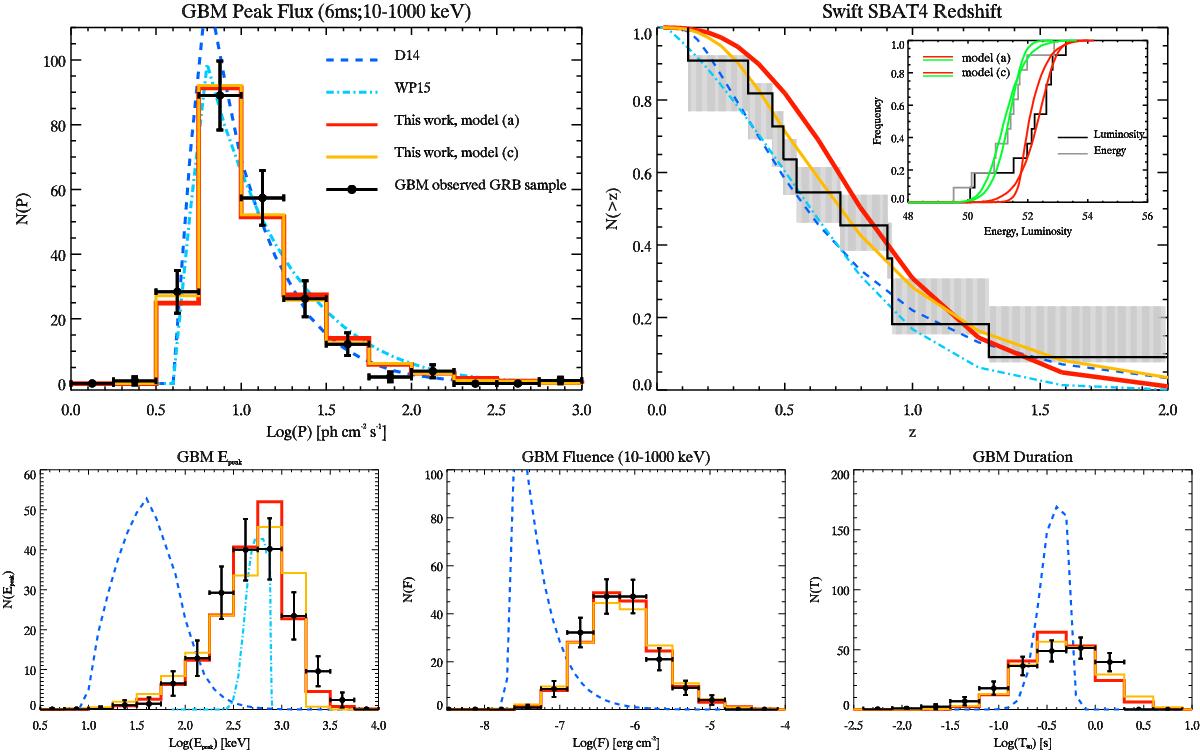
Black dots show the distributions obtained from our Fermi/GBM and Swift SBAT4 samples (Sect. 2). Horizontal error bars are the bin widths, while vertical error bars are 1σ errors on the bin heights accounting for experimental errors on single measurements. The results of our Monte Carlo population synthesis code are shown by solid red lines (assuming Ep−Liso and Ep−Eiso correlations to hold in the population of SGRBs) and by triple dot-dashed orange lines (assuming no correlation). Predictions based on the models of D14 and WP15 are shown by dashed blue and dot-dashed cyan lines, respectively (the latter only in the first three panels; see text). These are obtained by the analytical methods of Sect. 3.1. Top left panel: distribution of the peak flux P of the Fermi/GBM sample. Top right panel: normalized cumulative redshift distribution of the SBAT4 sample. The grey shaded area represents the range spanned by the distribution if the remaining bursts with unknown z are assigned the largest or the lowest z of the sample. The inset shows the cumulative distributions of the isotropic luminosity Liso (solid black line) and energy Eiso (solid grey line) of the same sample. Bottom panels: from left to right, distributions of peak energy Ep,o, fluence, and duration of SGRBs of our Fermi/GBM sample.
Current usage metrics show cumulative count of Article Views (full-text article views including HTML views, PDF and ePub downloads, according to the available data) and Abstracts Views on Vision4Press platform.
Data correspond to usage on the plateform after 2015. The current usage metrics is available 48-96 hours after online publication and is updated daily on week days.
Initial download of the metrics may take a while.