Free Access
Fig. 5
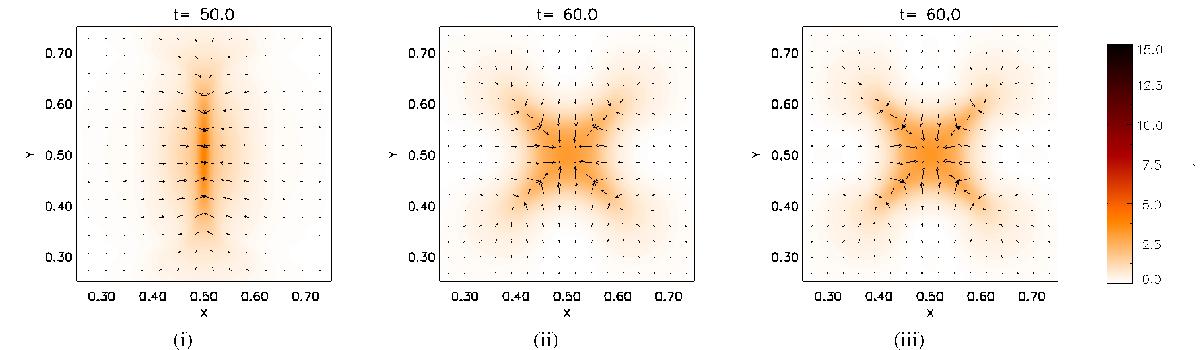
Projected Lorentz force in the plane (arrows) over-plotted on contours of the magnitude of the current density in the mid-plane between 0.25 <x,y< 0.75 at t = 50 for case i) 2 sources; and at t = 60 for cases ii) 4 weak sources and iii) 4 compact sources.
Current usage metrics show cumulative count of Article Views (full-text article views including HTML views, PDF and ePub downloads, according to the available data) and Abstracts Views on Vision4Press platform.
Data correspond to usage on the plateform after 2015. The current usage metrics is available 48-96 hours after online publication and is updated daily on week days.
Initial download of the metrics may take a while.