Fig. 9
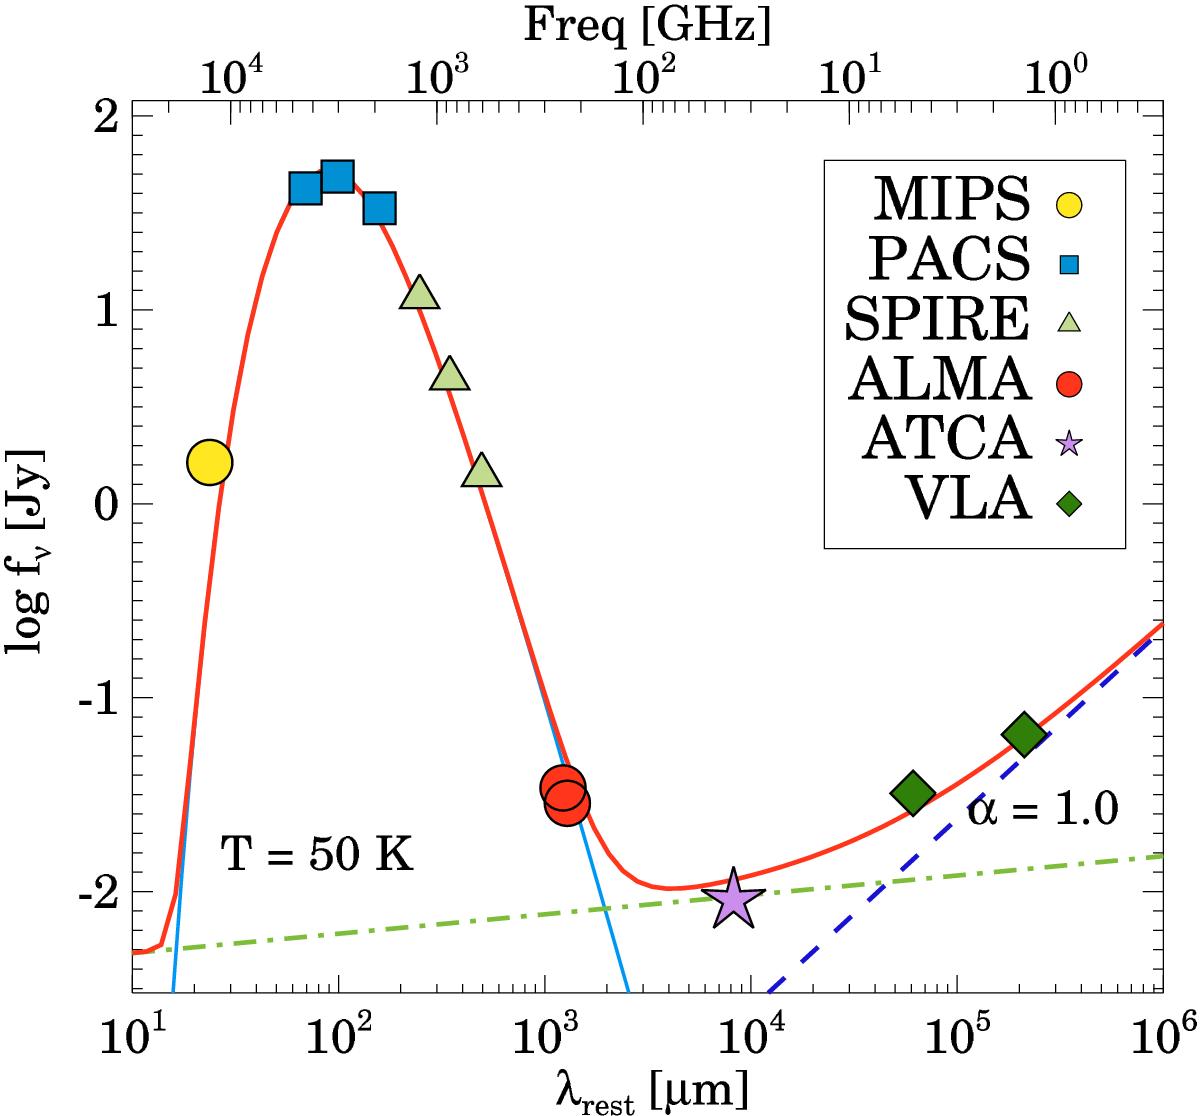
Far-IR and radio SED of ESO 320-G030. Tables 2 and 3 list the wavelength (or frequency), flux, and instrument of the plotted measurements. The cyan line is the best gray body fit to the far-IR photometry (Sect. 6.1.2), the dashed dark blue line the best power-law fit to the radio (ν ≤ 36 GHz) emission after subtracting the thermal radio continuum (dot-dash green line) to the observed data (Sect. 6.1.1). The solid red line is the sum of the three components (gray body, thermal radio continuum, and synchrotron). The error bars are smaller than the symbols.
Current usage metrics show cumulative count of Article Views (full-text article views including HTML views, PDF and ePub downloads, according to the available data) and Abstracts Views on Vision4Press platform.
Data correspond to usage on the plateform after 2015. The current usage metrics is available 48-96 hours after online publication and is updated daily on week days.
Initial download of the metrics may take a while.