Fig. 7
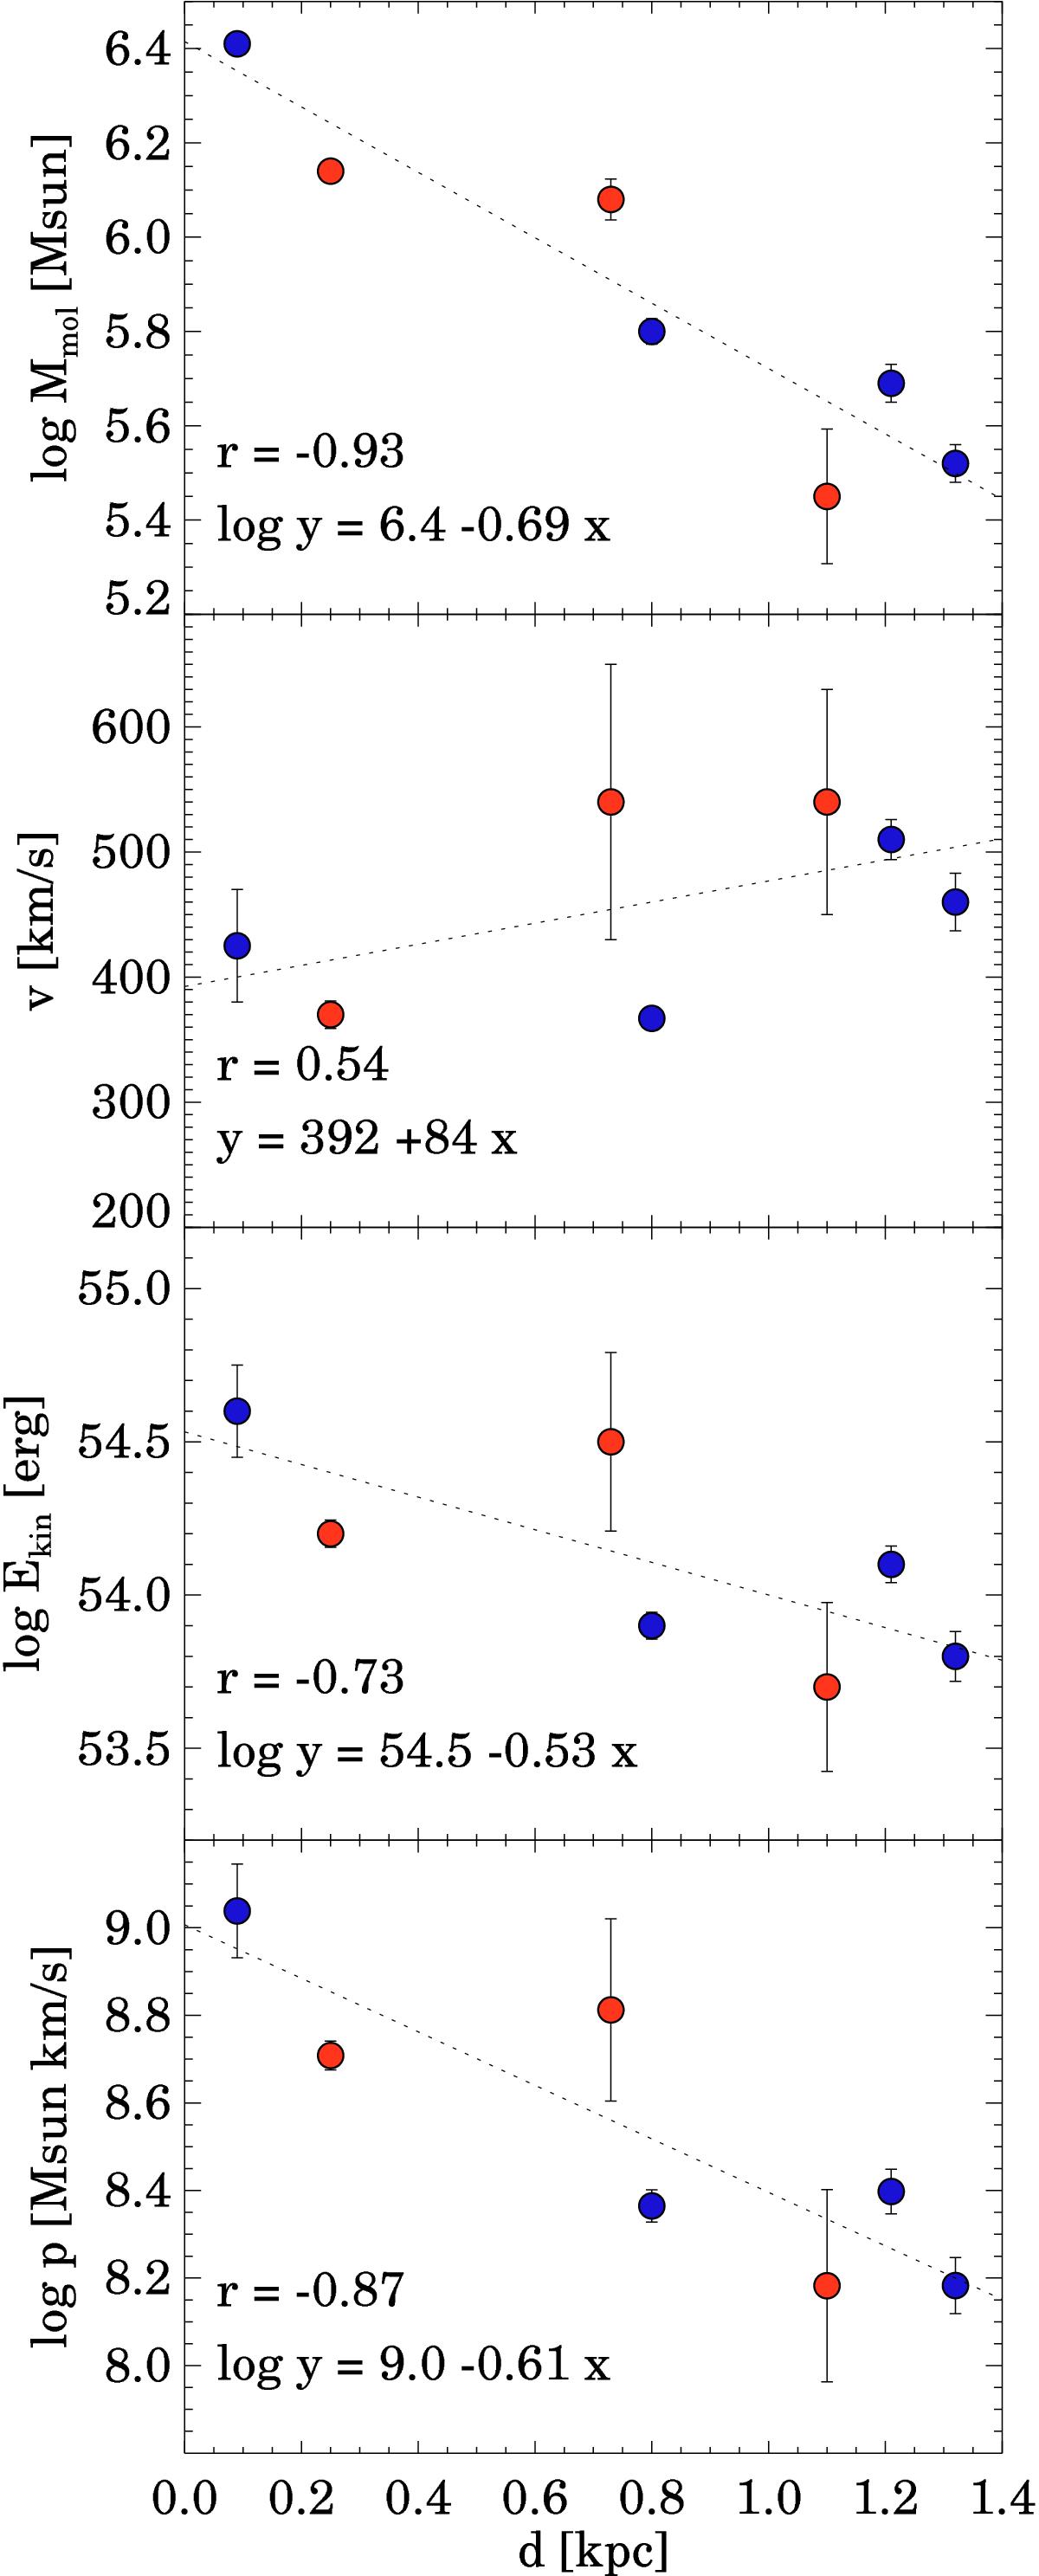
Logarithm of the molecular mass (first), velocity (second), kinetic energy (third), and momentum (fourth) of the outflowing clumps as a function of the deprojected distance from the nucleus. Blue and red points are blueshifted and redshifted clumps, respectively. The dotted line is the best fit. The parameters of the best fit and the Pearson correlation coefficients are indicated in each panel. The error bars correspond to the statistical uncertainties.
Current usage metrics show cumulative count of Article Views (full-text article views including HTML views, PDF and ePub downloads, according to the available data) and Abstracts Views on Vision4Press platform.
Data correspond to usage on the plateform after 2015. The current usage metrics is available 48-96 hours after online publication and is updated daily on week days.
Initial download of the metrics may take a while.