Fig. 6
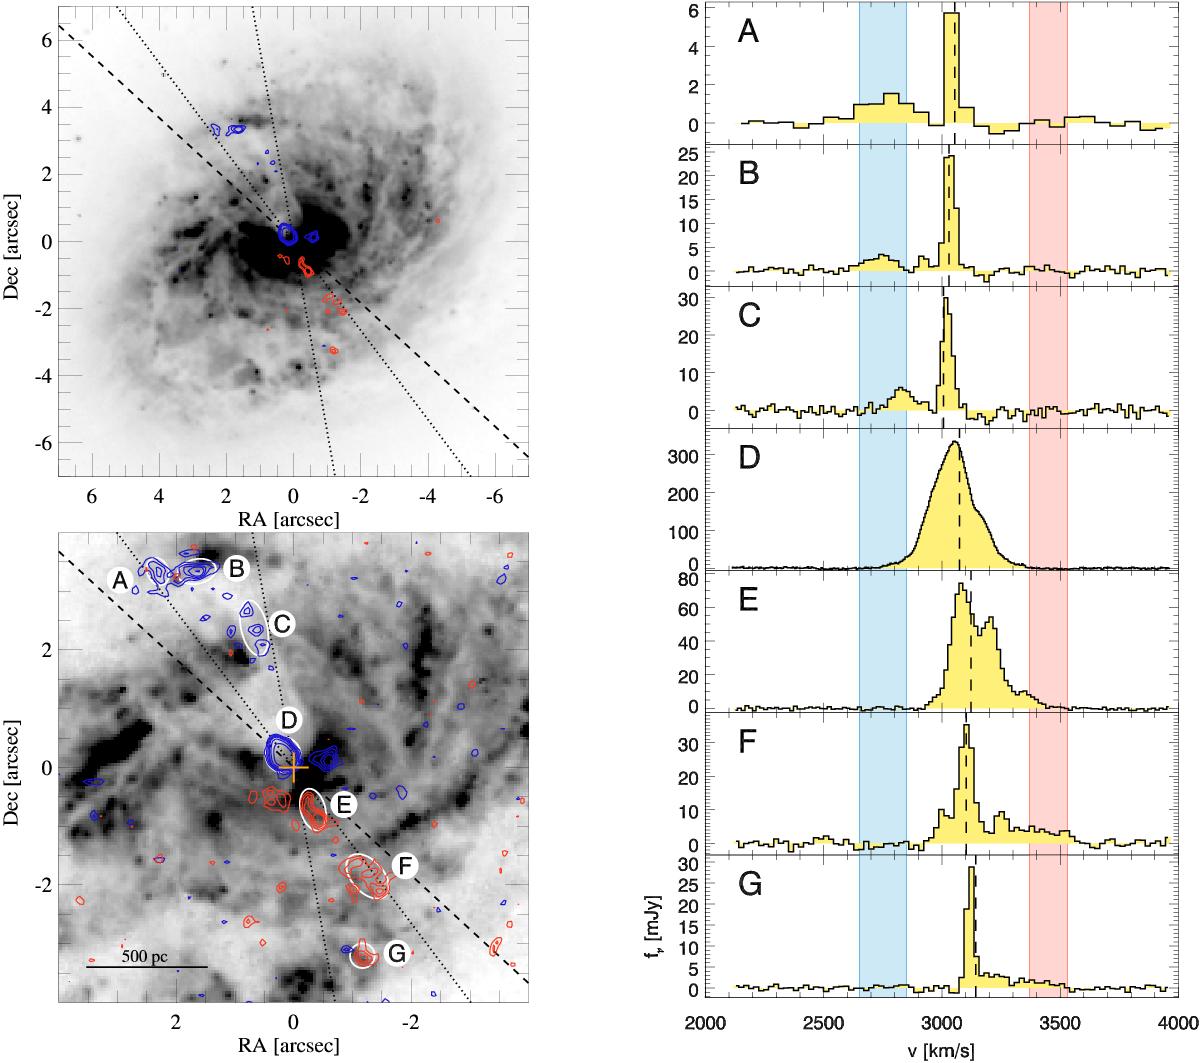
Left panels: CO(2−1) integrated emission between 2650 and 2850 km s-1 in blue contours and between 3370 and 3530 km s-1 in red contours. The contours correspond to 3, 4, 5, 6, 8, and 12σ levels in their respective bands (the 3σ contour level is not plotted in the top left panel for clarity). The background of the top left panel is the HST/ACS F814W image which shows the internal spiral arms. The background of the bottom left panel is the HST/ACS FR656N image to maximize the contrast of the dust lanes. The dashed line indicates the minor kinematic axis and the dotted lines indicate the approximate opening angle of the outflowing gas. The orange cross marks the position of the 233 GHz continuum peak. Right panels: CO(2−1) spectra of the regions marked in the bottom left panel. The blue and red shaded areas indicate the velocity ranges used to construct the blue and red contours, respectively. The vertical dashed line corresponds to the velocity derived in Sect. 4 assuming a rotating disk model. To increase the signal-to-noise ratio, we binned the spectra in channels of 60, 20, 15, 5, 15, 20, and 20 km s-1from top to bottom.
Current usage metrics show cumulative count of Article Views (full-text article views including HTML views, PDF and ePub downloads, according to the available data) and Abstracts Views on Vision4Press platform.
Data correspond to usage on the plateform after 2015. The current usage metrics is available 48-96 hours after online publication and is updated daily on week days.
Initial download of the metrics may take a while.