Free Access
Fig. 5
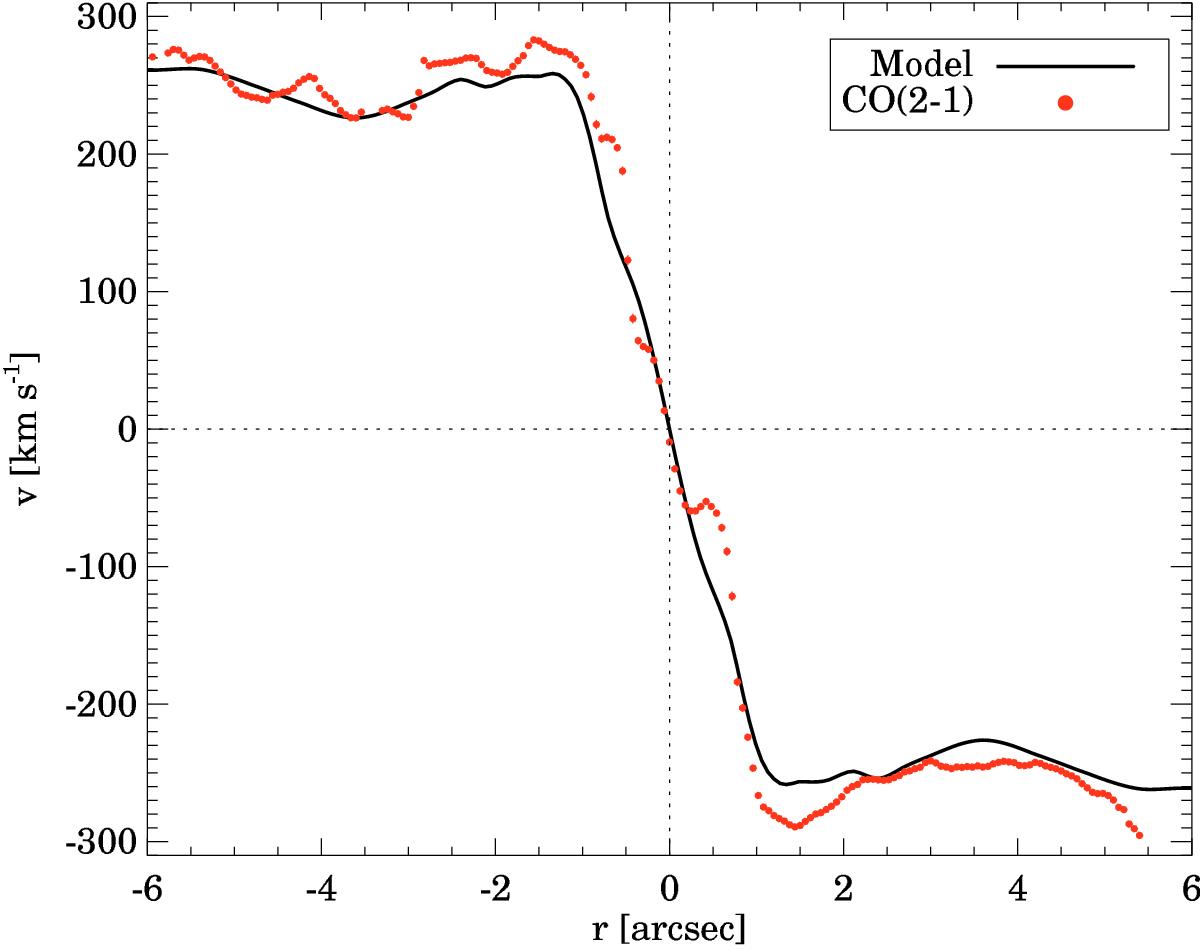
Rotation curve corrected for inclination (i = 43°) along the major axis (PA = 133°) for the cold molecular gas traced by the CO(2−1) transition (red circles). The error bars of the CO(2−1) points are 1−2 km s-1. The solid black line is the best fit model to the CO(2−1) data (see Sect. 4).
Current usage metrics show cumulative count of Article Views (full-text article views including HTML views, PDF and ePub downloads, according to the available data) and Abstracts Views on Vision4Press platform.
Data correspond to usage on the plateform after 2015. The current usage metrics is available 48-96 hours after online publication and is updated daily on week days.
Initial download of the metrics may take a while.