Fig. 4
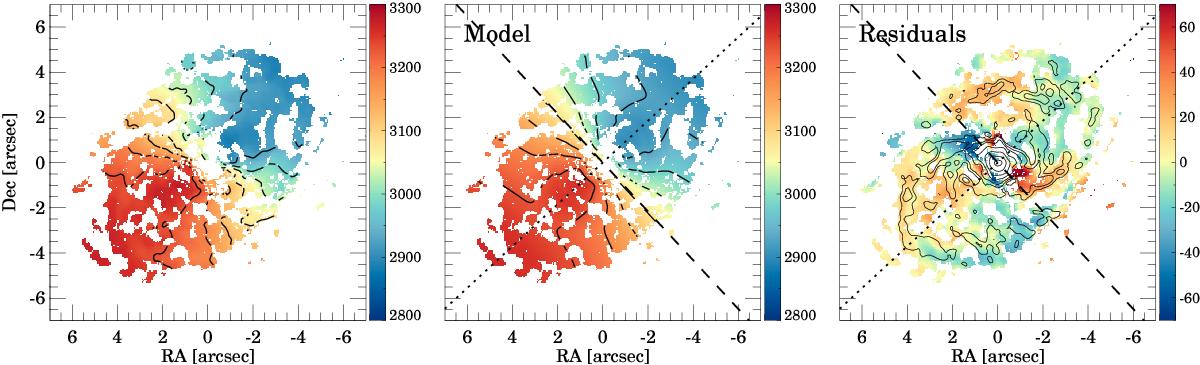
Left panel: CO(2−1) velocity field after excluding those pixels with complex line profiles. Middle panel: best fitting model (see Sect. 4). In these two panels, the contour levels are set in steps of 50 km s-1 from v(lsrk) = 2800 to 3300 km s-1. Right panel: residuals (data − model) and the CO(2−1) emission contours as in Fig. 1. The dotted and the dashed lines indicate the major and minor kinematic axes.
Current usage metrics show cumulative count of Article Views (full-text article views including HTML views, PDF and ePub downloads, according to the available data) and Abstracts Views on Vision4Press platform.
Data correspond to usage on the plateform after 2015. The current usage metrics is available 48-96 hours after online publication and is updated daily on week days.
Initial download of the metrics may take a while.