Fig. 5
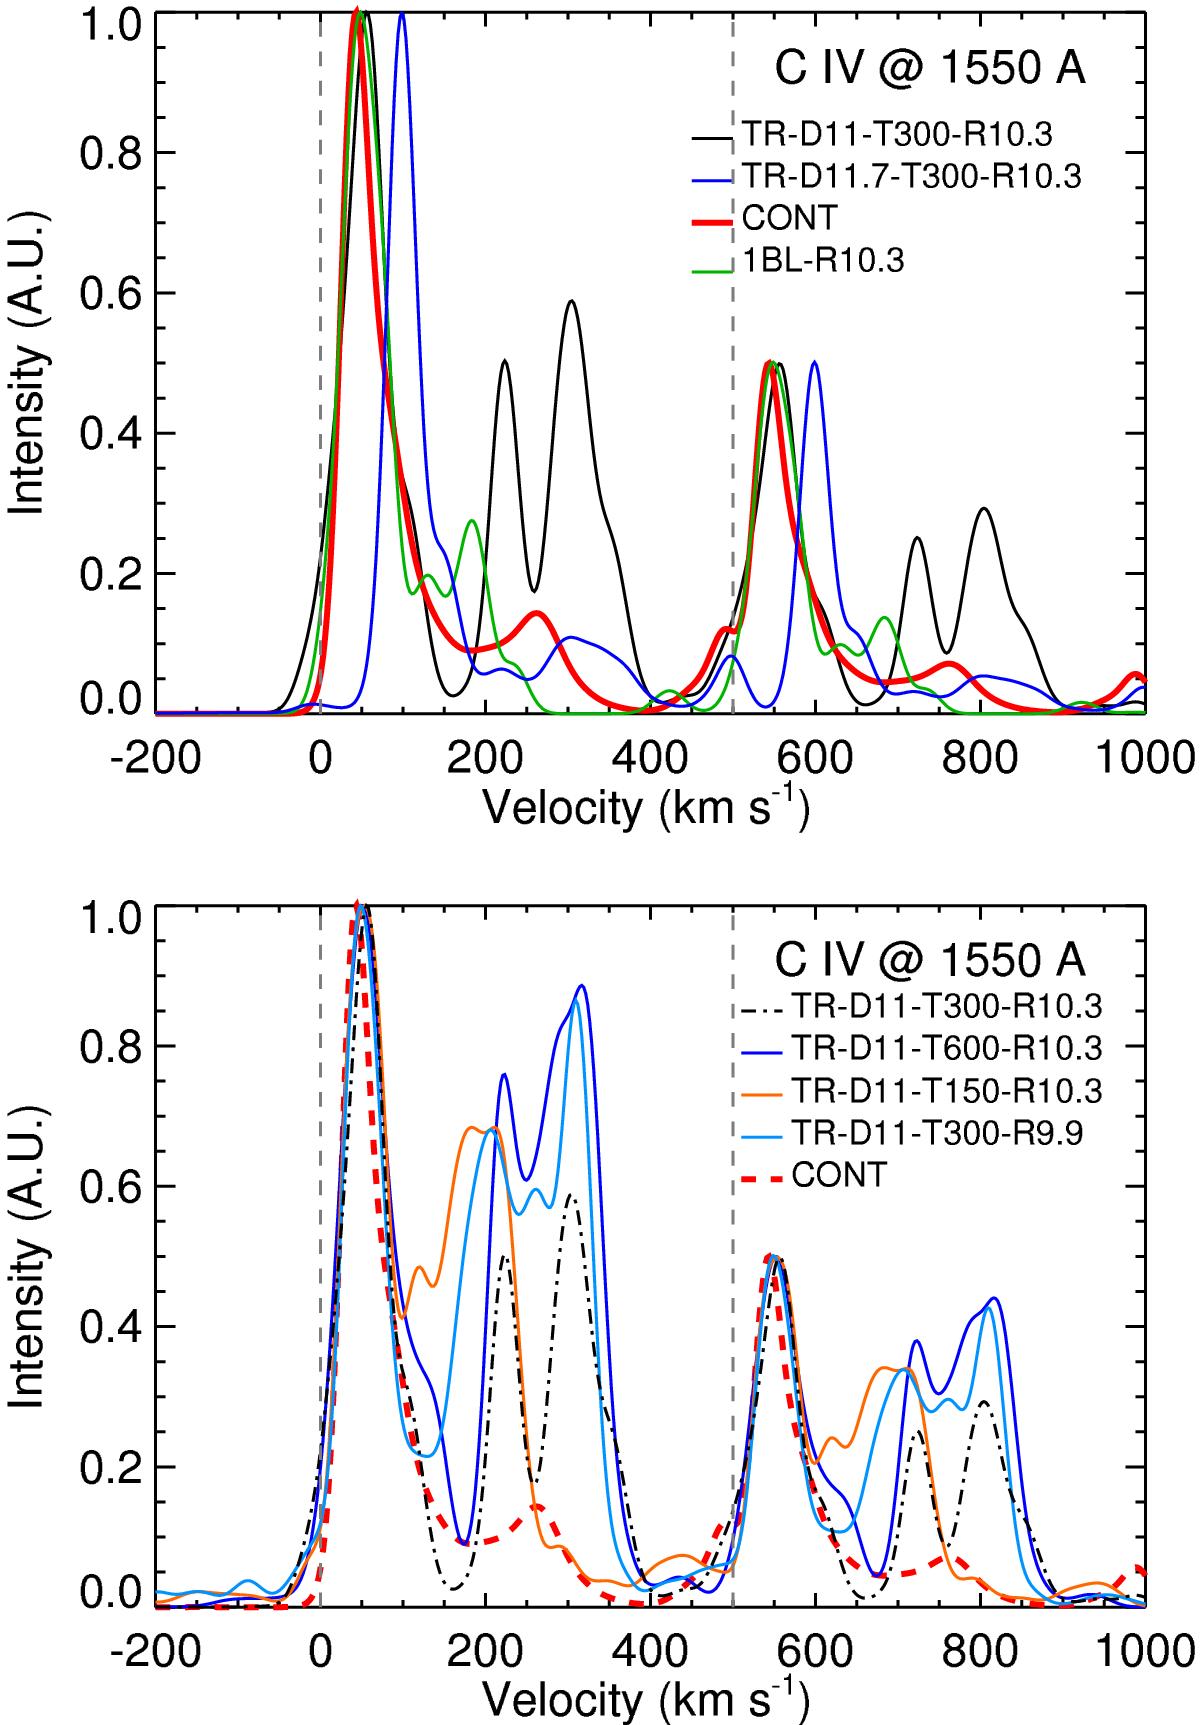
Synthetic profiles of C IV doublet; all the profiles are normalized to their maximum value. The upper panel compares our reference simulation of a train of blobs (run TR-D11-T300-R10.3) with the case of a continuous stream (run CONT), the case of a single downfalling blob (run 1BL-R10.3), and with the case of a train of blobs with higher density (run TR-D11.7-T300-R10.3). The lower panel compares profiles derived from simulations of a train of blobs differing for the frequency and size of blobs (runs TR-D11-T300-R10.3, TR-D11-T600-R10.3, TR-D11-T150-R10.3, TR-D11-T300-R9.9). The dotted gray lines are the rest positions of the lines of the doublet.
Current usage metrics show cumulative count of Article Views (full-text article views including HTML views, PDF and ePub downloads, according to the available data) and Abstracts Views on Vision4Press platform.
Data correspond to usage on the plateform after 2015. The current usage metrics is available 48-96 hours after online publication and is updated daily on week days.
Initial download of the metrics may take a while.