Fig. 7
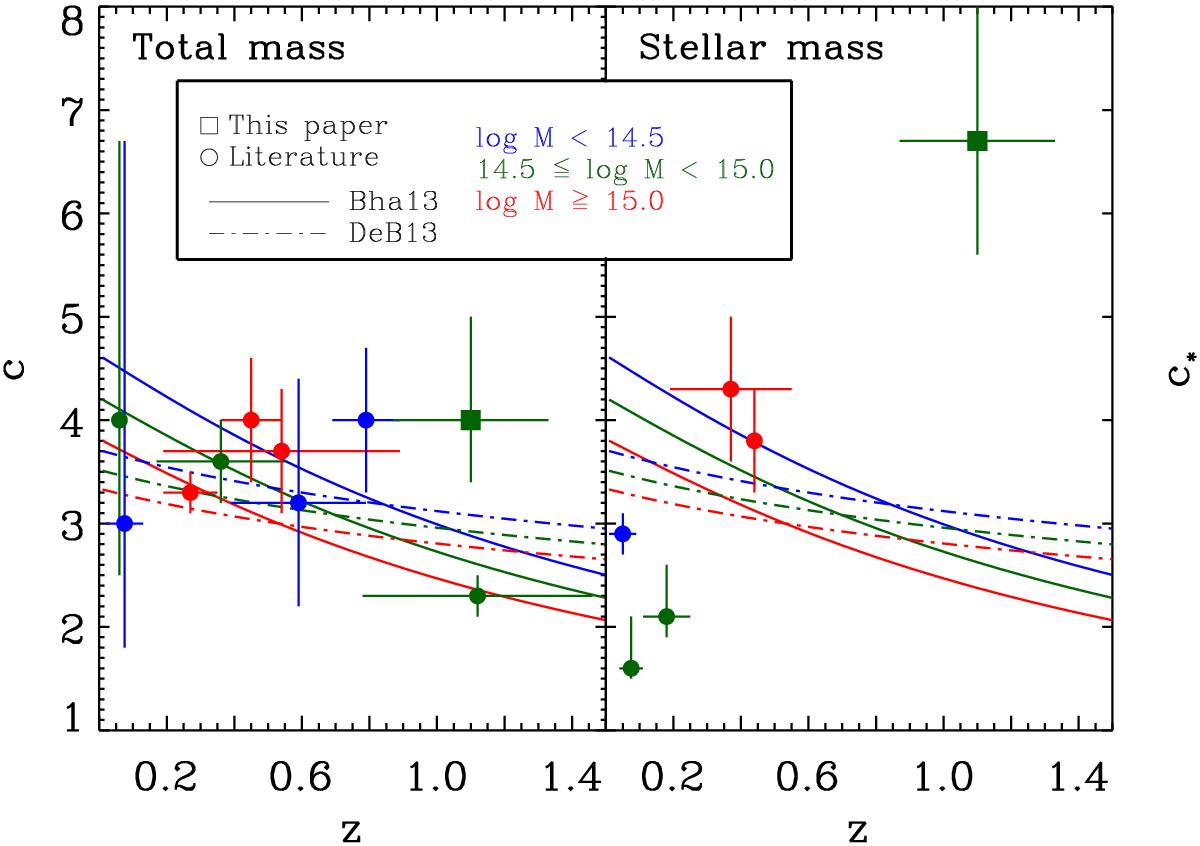
Total and stellar mass concentration vs. redshift. The theoretical relations from Bhattacharya et al. (2013; solid lines) and from De Boni et al. (2013; dash-dotted lines) are shown for halos of masses log M200/M⊙ = 14.25,14.75,15.25 (blue, green, red curves, resp.). The data-points represent determinations of the total and stellar mass concentrations (left and right panel, resp.) from the literature and the present work (indicated by a square). The points are colored according to the average mass of the sample of clusters used for the determination of c: log M200/M⊙< 14.5 (blue), 14.5 ≤ log M200/M⊙< 15.0 (green), log M200/M⊙ ≥ 15.0 (red). The data references can be found in Table 3.
Current usage metrics show cumulative count of Article Views (full-text article views including HTML views, PDF and ePub downloads, according to the available data) and Abstracts Views on Vision4Press platform.
Data correspond to usage on the plateform after 2015. The current usage metrics is available 48-96 hours after online publication and is updated daily on week days.
Initial download of the metrics may take a while.