Fig. 6
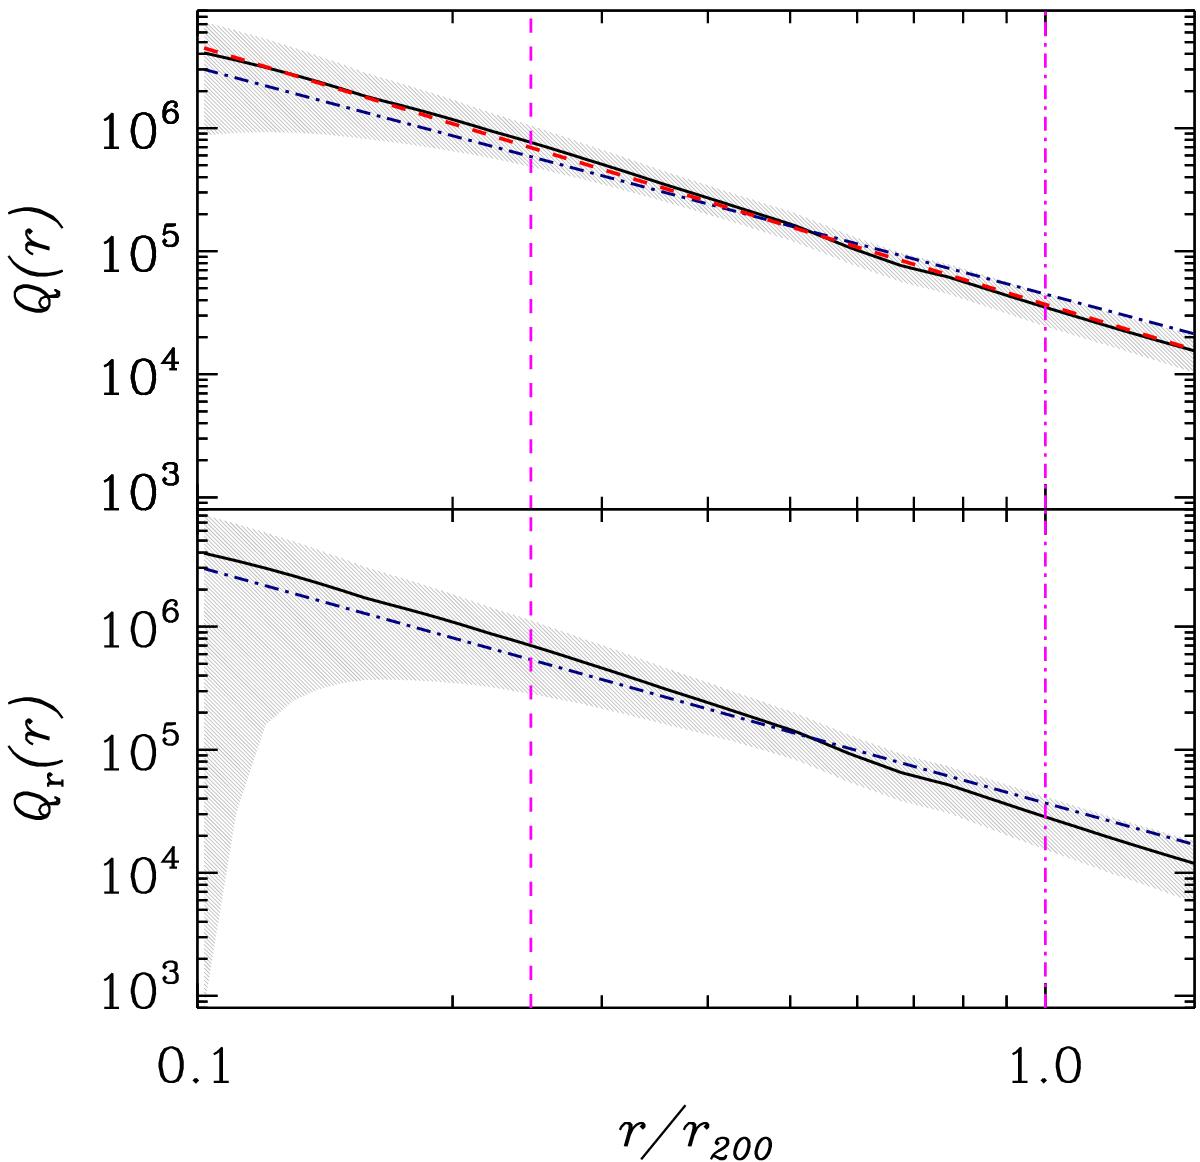
Pseudo-phase-space density profiles of the stack cluster. Solid lines: Q(r) ≡ ρ/σ3 (top panel) and ![]() (bottom panel), as a function of cluster-centric radius r/r200, within 1 σ confidence regions (shaded gray regions). The dash-dotted (navy) lines are the theoretical relations Q(r) ∝ r-1.84 and Qr(r) ∝ r-1.92 from Dehnen & McLaughlin (2005), with free normalization fit to the data. The dashed (red) line in the top panel is the theoretical relation Q(r) ∝ r-2.1 for massive halos at z = 1 from Fig. 6 in Lapi & Cavaliere (2009). The line is almost indistinguishable from the observational relation (solid black line). In both panels, the vertical dashed and dash-dotted (magenta) lines indicate the location of r-2 and r200, respectively.
(bottom panel), as a function of cluster-centric radius r/r200, within 1 σ confidence regions (shaded gray regions). The dash-dotted (navy) lines are the theoretical relations Q(r) ∝ r-1.84 and Qr(r) ∝ r-1.92 from Dehnen & McLaughlin (2005), with free normalization fit to the data. The dashed (red) line in the top panel is the theoretical relation Q(r) ∝ r-2.1 for massive halos at z = 1 from Fig. 6 in Lapi & Cavaliere (2009). The line is almost indistinguishable from the observational relation (solid black line). In both panels, the vertical dashed and dash-dotted (magenta) lines indicate the location of r-2 and r200, respectively.
Current usage metrics show cumulative count of Article Views (full-text article views including HTML views, PDF and ePub downloads, according to the available data) and Abstracts Views on Vision4Press platform.
Data correspond to usage on the plateform after 2015. The current usage metrics is available 48-96 hours after online publication and is updated daily on week days.
Initial download of the metrics may take a while.