Fig. 5
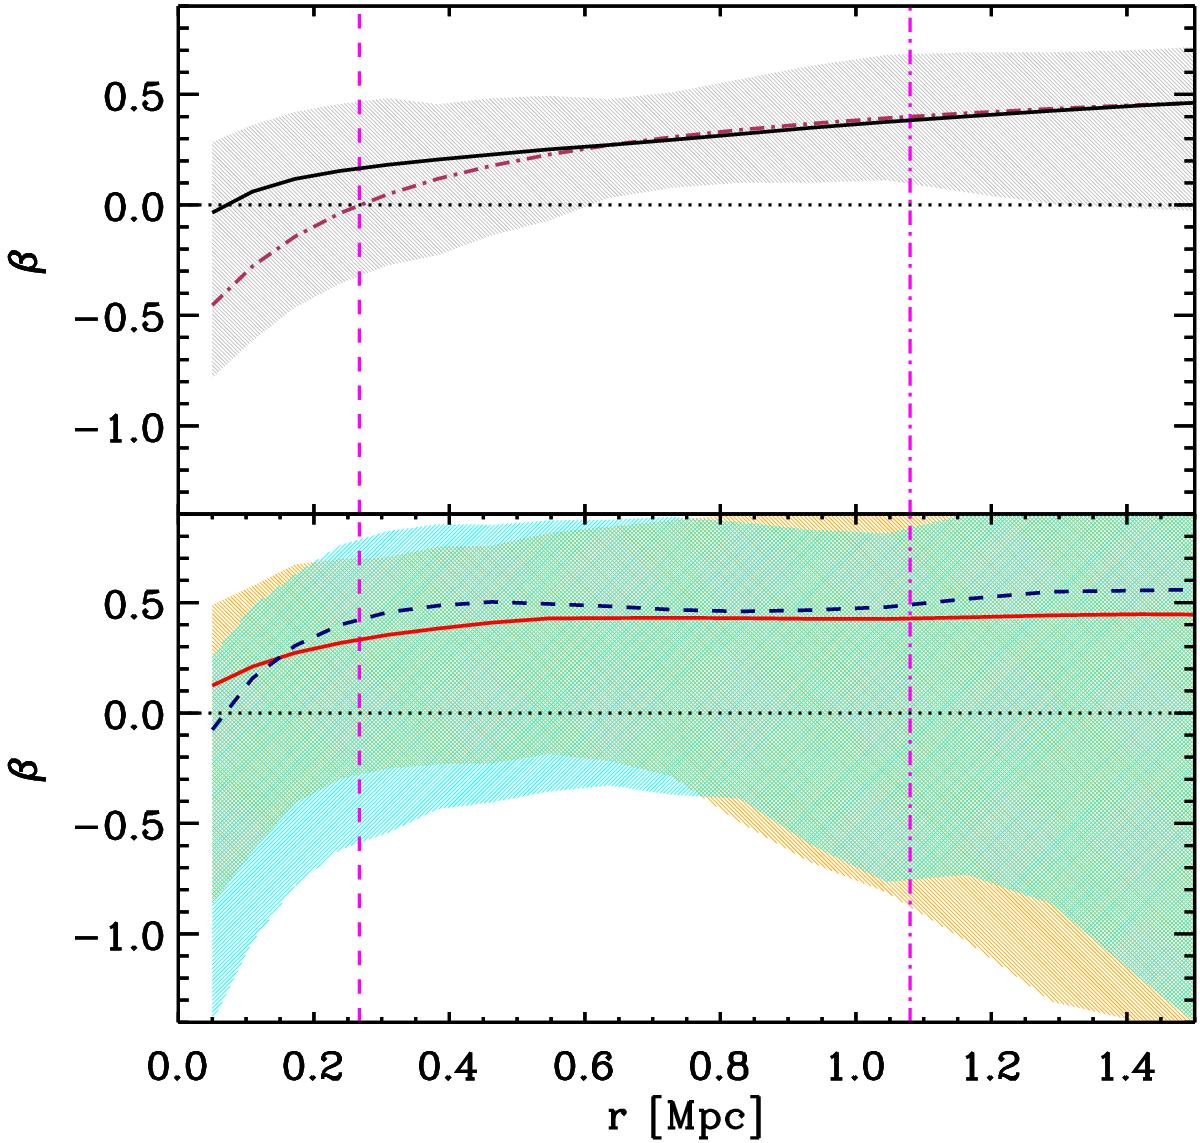
Velocity anisotropy profiles β(r), of different cluster galaxy populations as obtained from the inversion of the Jeans equation adopting the best-fit MAMPOSSt solution for the mass profile. Top panel: all cluster members. The β(r) is represented by the solid (black) curve and the hatched gray region represents 68% confidence levels on the solution. The best-fit MAMPOSSt β(r) model is represented by the dot-dashed (brown) curve. In both panels, the vertical dashed and dash-dotted (magenta) lines indicate the location of r-2 and r200, respectively, and the horizontal dotted line indicates β = 0. Below (resp. above) this line, galaxy orbits are more tangentially (resp. radially) elongated. Bottom panel: passive and SF cluster members, separately. Their β(r) are represented by red solid and blue dashed curves, resp. for passive and SF galaxies, within their 68% confidence levels (orange and cyan hatched regions, for passive and SF, resp.; green in the overlap region).
Current usage metrics show cumulative count of Article Views (full-text article views including HTML views, PDF and ePub downloads, according to the available data) and Abstracts Views on Vision4Press platform.
Data correspond to usage on the plateform after 2015. The current usage metrics is available 48-96 hours after online publication and is updated daily on week days.
Initial download of the metrics may take a while.