Fig. 4
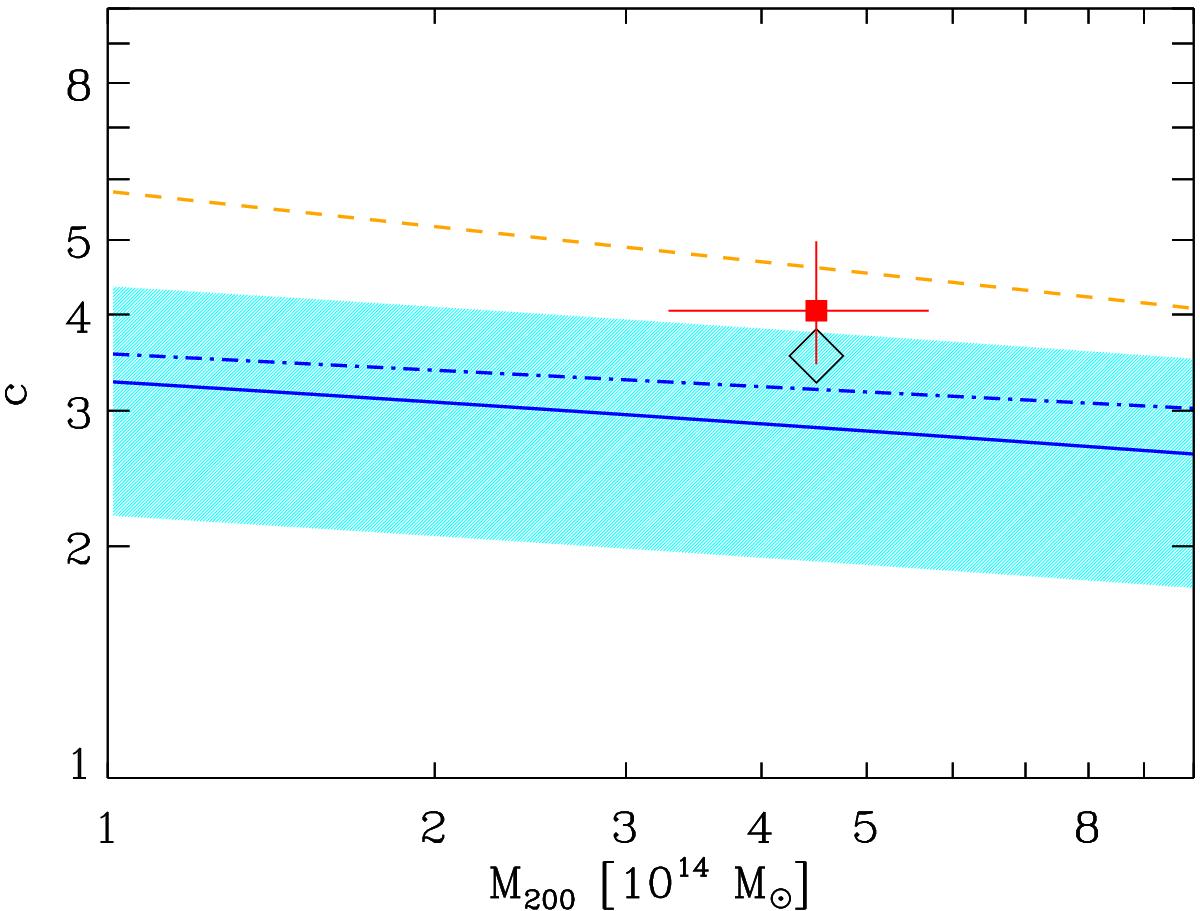
Concentration-mass (c vs. M200) theoretical relations and scatter of Bhattacharya et al. (2013, blue solid line and cyan region) and De Boni et al. (2013, blue dash-dotted line), the observational relation of Groener et al. (2016, orange dashed line), and the [ c,M200 ] value obtained for our stack cluster. The M200 value is taken from Sect. 2.3; the c value is derived from the r200 value of Sect. 2.3 and either the r-2 value of the best-fit MAMPOSSt model (Bur+O; red square and 1σ uncertainties) or that obtained by taking the average of all twelve models, weighted according to their relative likelihoods (black diamond; the vertical size of the diamond represents the weighted dispersion of best-fit concentration parameters, but does not include the statistical uncertainty on the measurements).
Current usage metrics show cumulative count of Article Views (full-text article views including HTML views, PDF and ePub downloads, according to the available data) and Abstracts Views on Vision4Press platform.
Data correspond to usage on the plateform after 2015. The current usage metrics is available 48-96 hours after online publication and is updated daily on week days.
Initial download of the metrics may take a while.