Free Access
Fig. 1
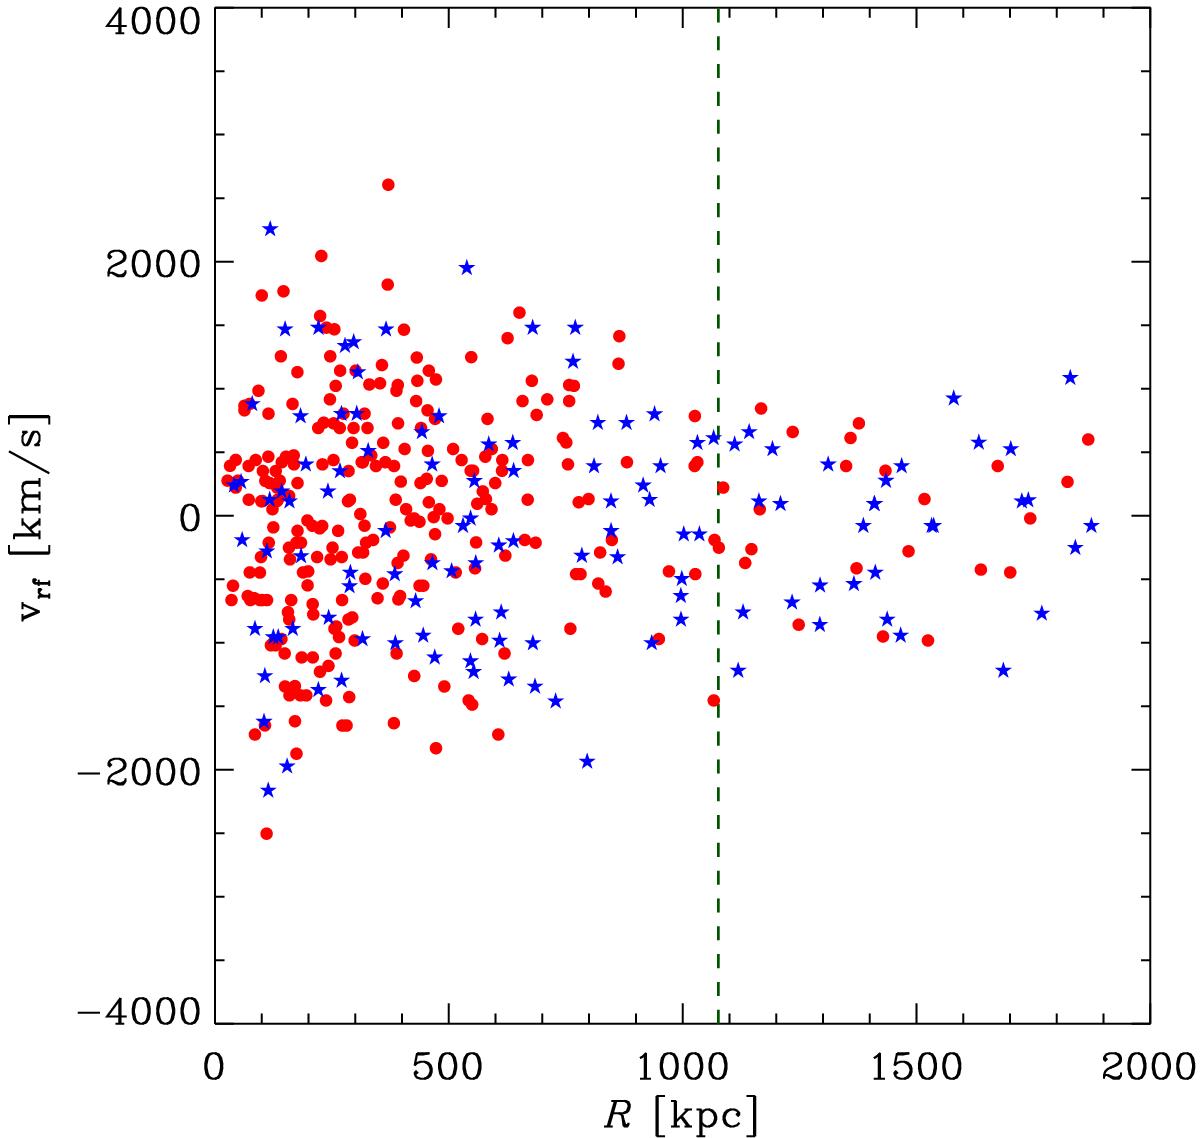
Projected phase-space distribution of galaxies in the stack cluster, vrf vs. R, obtained by multiplying the normalized quantities vn and Rn by the mean values of v200 and r200, resp., for the clusters contributing to the stack. The vertical line indicate the mean value of r200. Red dots indicate PG, blue stars SFG.
Current usage metrics show cumulative count of Article Views (full-text article views including HTML views, PDF and ePub downloads, according to the available data) and Abstracts Views on Vision4Press platform.
Data correspond to usage on the plateform after 2015. The current usage metrics is available 48-96 hours after online publication and is updated daily on week days.
Initial download of the metrics may take a while.