Free Access
Fig. 9
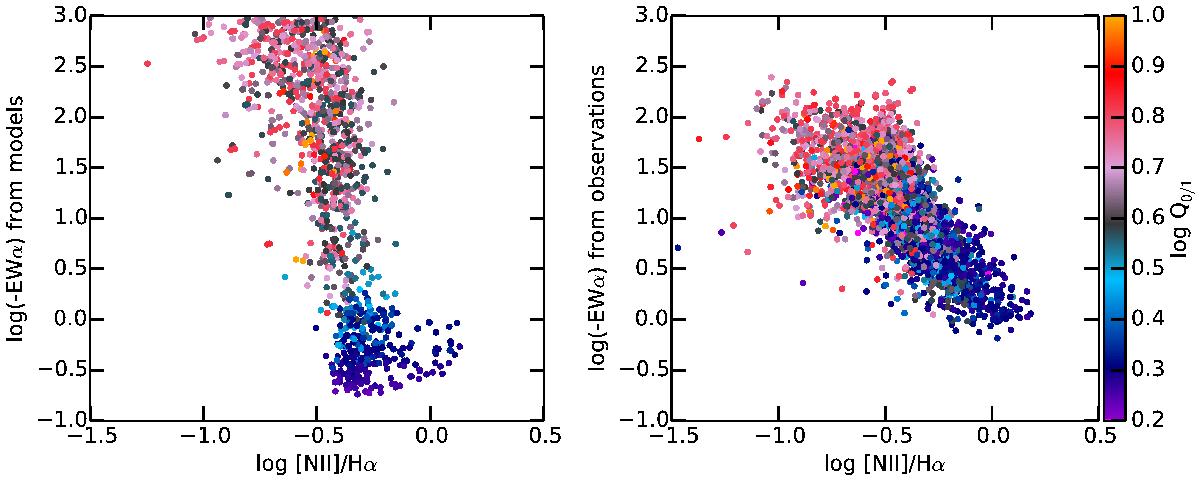
WHAN diagrams: values of EWα from the models (left panel) and from the observations (right panel) as a function of [N ii]/Hα. The color code represents the proportion of OB stars.
Current usage metrics show cumulative count of Article Views (full-text article views including HTML views, PDF and ePub downloads, according to the available data) and Abstracts Views on Vision4Press platform.
Data correspond to usage on the plateform after 2015. The current usage metrics is available 48-96 hours after online publication and is updated daily on week days.
Initial download of the metrics may take a while.