Free Access
Fig. 8
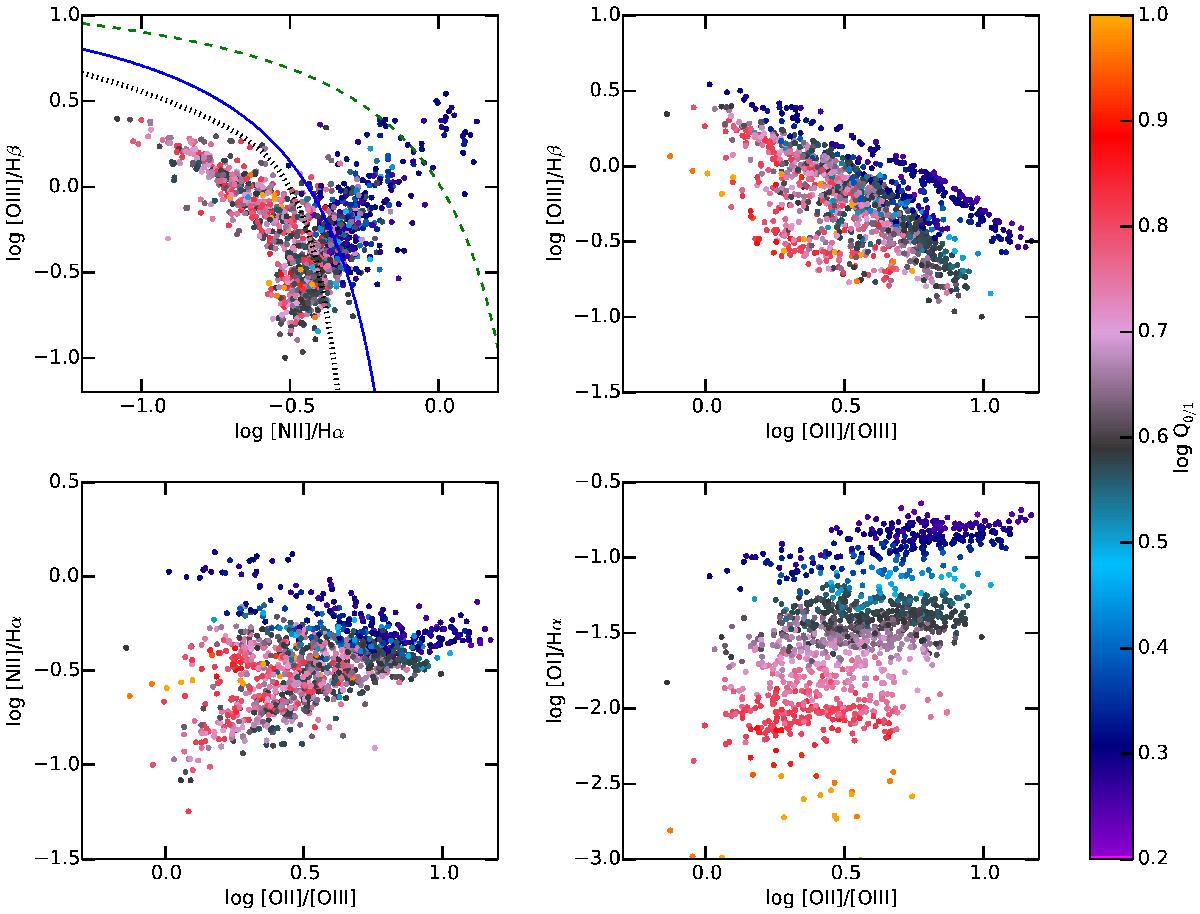
BPT diagrams inspired by Baldwin et al. (1981). The color code represents the hardness of the radiation Q0 / 1. The solid blue line is from Kauffmann et al. (2003), the green dashed line is from Kewley et al. (2001), and the dotted black line is from Stasińska et al. (2006).
Current usage metrics show cumulative count of Article Views (full-text article views including HTML views, PDF and ePub downloads, according to the available data) and Abstracts Views on Vision4Press platform.
Data correspond to usage on the plateform after 2015. The current usage metrics is available 48-96 hours after online publication and is updated daily on week days.
Initial download of the metrics may take a while.