Fig. 7
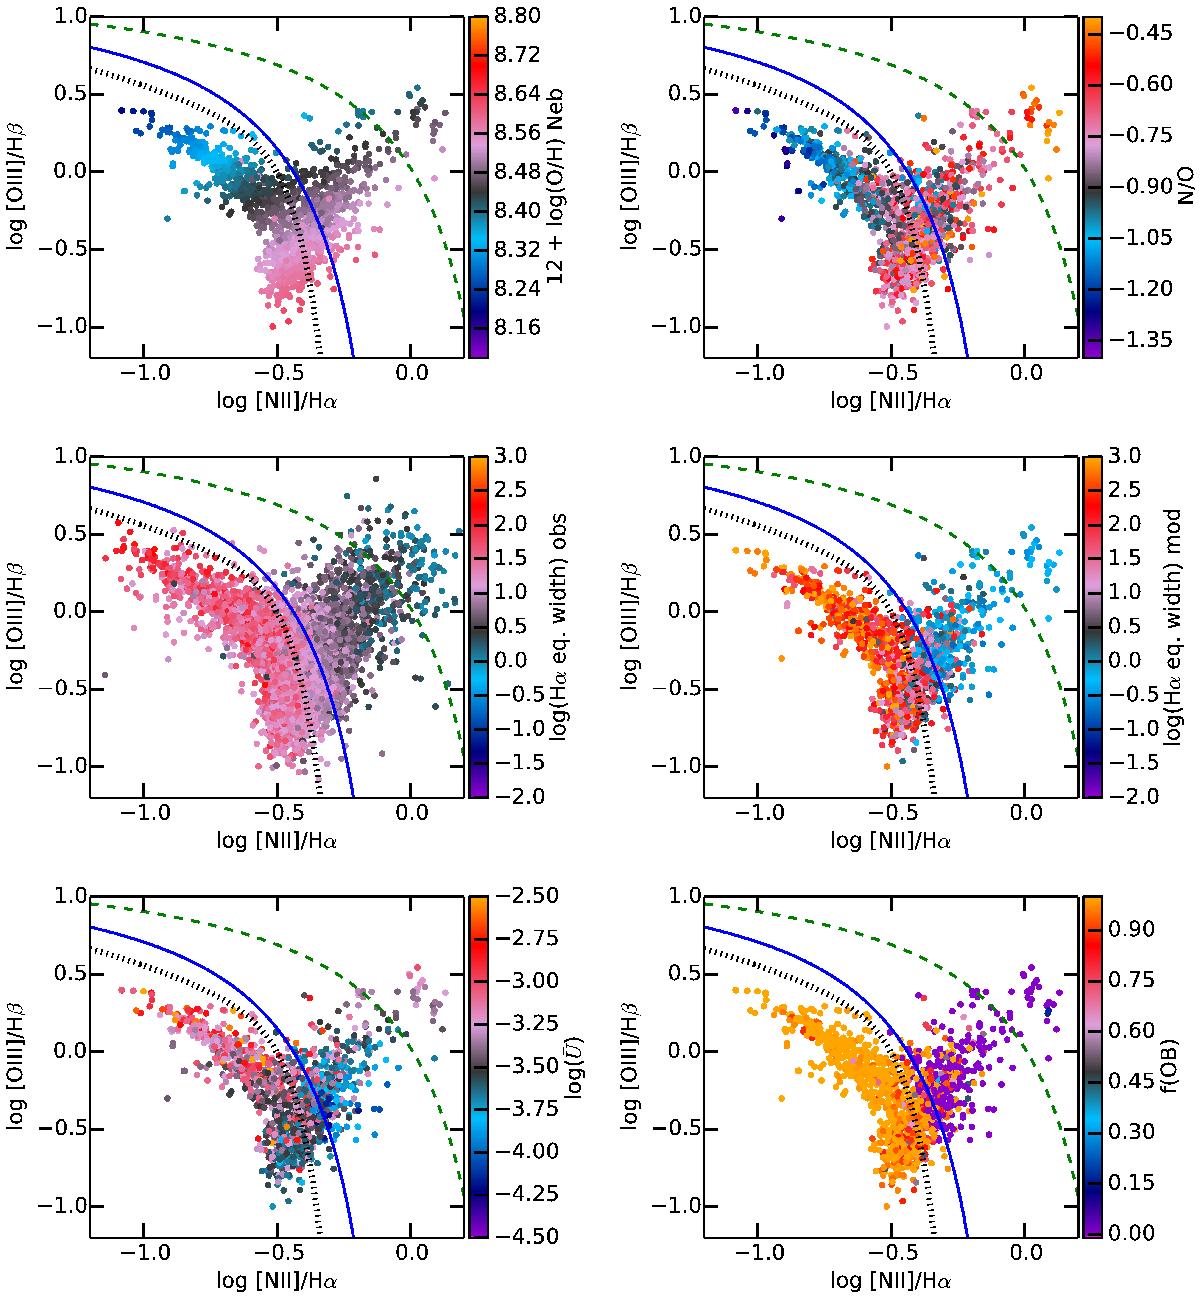
Classical BPT diagrams of the model results. For each panel, the color code is changed according to the description on the right of the corresponding color bar. The upper panels show distributions of the models, with colors related to the chemical abundances: O/H on the left and N/O on the right. The middle panels show the distribution of the Hα equivalent width determined from the observations and from the models in the left and right panels, respectively. The lower panels show the distribution of the mean ionization parameter ![]() and the proportion of OB stars in the ionizing SED in the left and right panels, respectively. The solid blue line is from Kauffmann et al. (2003), the green dashed line is from Kewley et al. (2001), and the dotted black line is from Stasińska et al. (2006).
and the proportion of OB stars in the ionizing SED in the left and right panels, respectively. The solid blue line is from Kauffmann et al. (2003), the green dashed line is from Kewley et al. (2001), and the dotted black line is from Stasińska et al. (2006).
Current usage metrics show cumulative count of Article Views (full-text article views including HTML views, PDF and ePub downloads, according to the available data) and Abstracts Views on Vision4Press platform.
Data correspond to usage on the plateform after 2015. The current usage metrics is available 48-96 hours after online publication and is updated daily on week days.
Initial download of the metrics may take a while.