Fig. 5
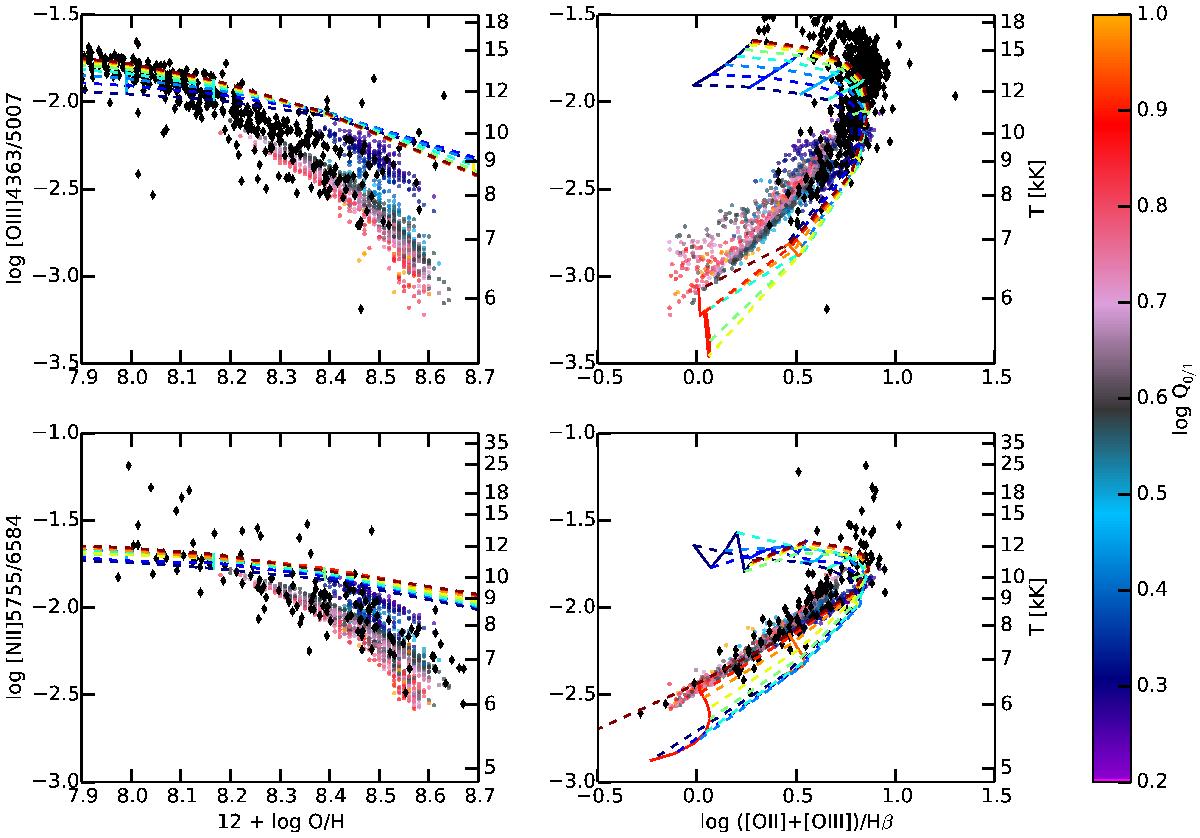
Electron temperature diagnostic line ratios as a function of O/H (left panels) and ([O iii]λ5007 + [O ii]λ3727)/Hβ (right panels) for our models (colored circles). From top to bottom, the diagnostics are [O iii]λ4363/λ5007 and [N ii]λ5755/λ6584. Black diamonds represent the Te-based sample of H ii regions used by Marino et al. (2013). The dashed lines correspond to the grid of models computed by Dopita et al. (2013). The color bar follows Q0 / 1, the softness of the ionizing radiation.
Current usage metrics show cumulative count of Article Views (full-text article views including HTML views, PDF and ePub downloads, according to the available data) and Abstracts Views on Vision4Press platform.
Data correspond to usage on the plateform after 2015. The current usage metrics is available 48-96 hours after online publication and is updated daily on week days.
Initial download of the metrics may take a while.