Fig. 3
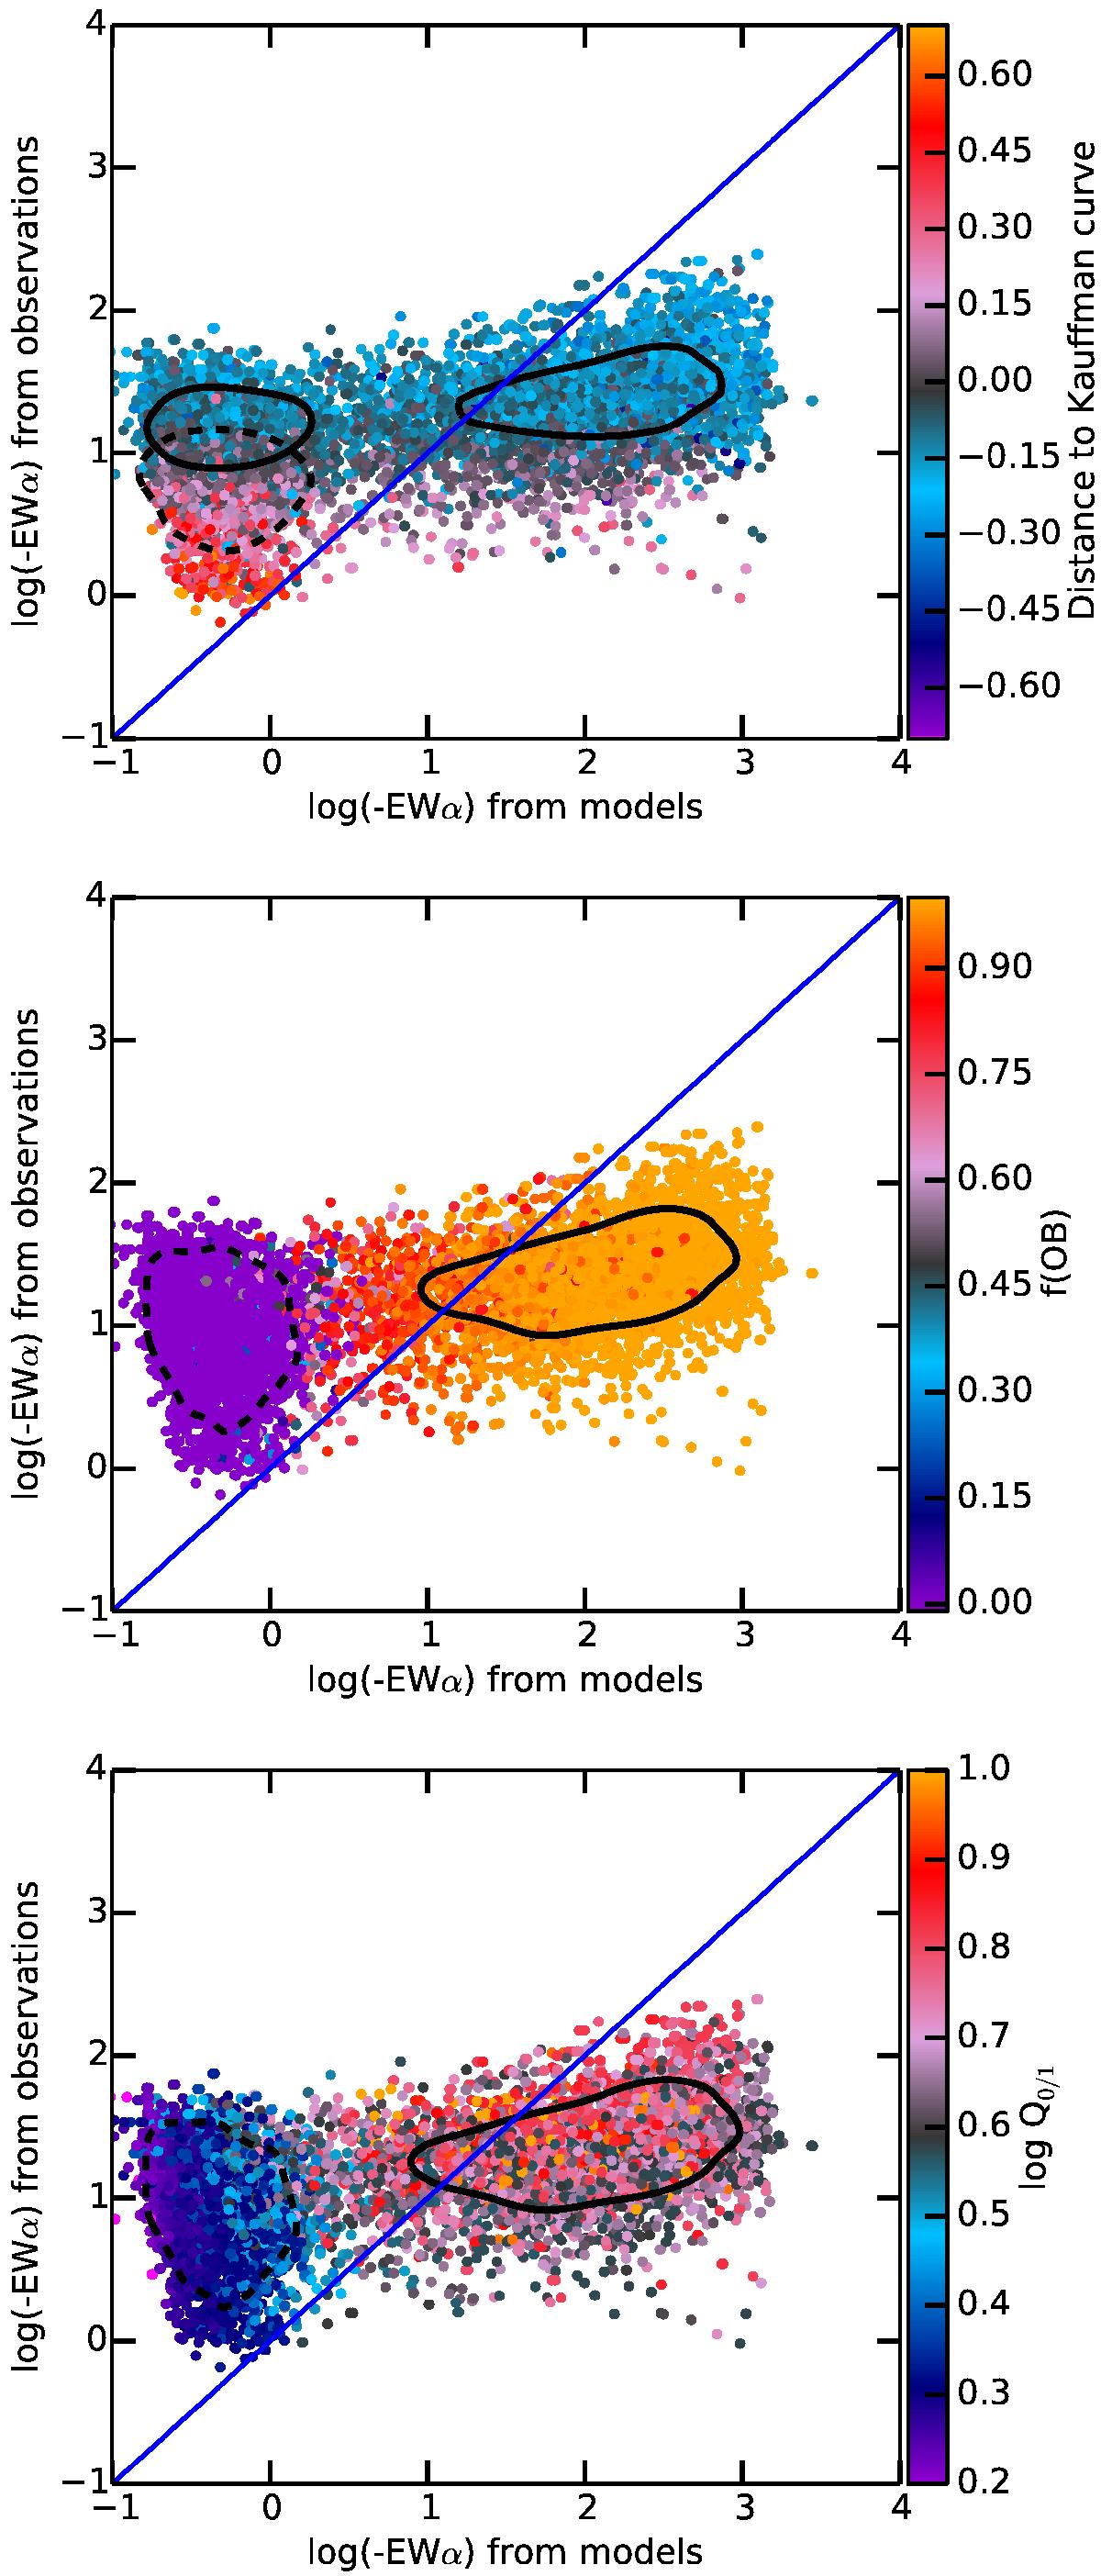
Comparison between the EWα from the models and from the observations. Colors represent Kdist, the distance to the Kauffmann et al. (2003) curve (upper panel), the OB stars proportion f(OB) (middle panel), and the ratio Q0 / 1 = Q(He0)/Q(H0) (lower panel). The solid blue line follows y = x. In the upper panel, the solid black curves enclose half of the models that are below the Kauffman curve (negative Kdist), while the dashed black curve encloses half of the models above the same curve (positive Kdist). In the middle panel, the solid black contour encloses half of the models ionized by OB stars (f(OB) > 0.5), while the dashed black contour encloses half of the models ionized by HOLMES (f(OB) < 0.5). In the lower panel, the solid black contour encloses half of the models ionized by OB stars (Q0 / 1 > 0.55), while the dashed black contour encloses half of the models ionized by HOLMES (Q0 / 1 < 0.55).
Current usage metrics show cumulative count of Article Views (full-text article views including HTML views, PDF and ePub downloads, according to the available data) and Abstracts Views on Vision4Press platform.
Data correspond to usage on the plateform after 2015. The current usage metrics is available 48-96 hours after online publication and is updated daily on week days.
Initial download of the metrics may take a while.