Fig. 13
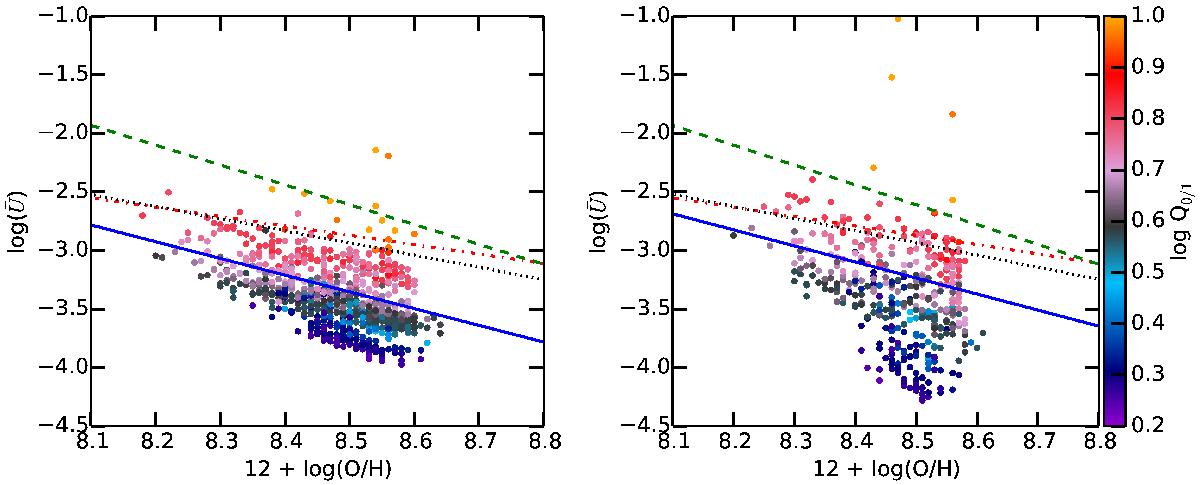
![]() vs. O/H. Left panel: thin shell models (fr = 3.0), right panel: filled sphere models (fr = 0.03). The solid red dot-dashed line corresponds to the relation from Dopita & Evans (1986), the green dashed line to Dopita et al. (2006), and the red dotted line to a fit to Fig. 3 from Pérez-Montero (2014). The color code follows Q0 / 1. Our fit is shown with the blue line; it is obtained considering only the Q0 / 1 > 0.55 regions (see text for the corresponding values).
vs. O/H. Left panel: thin shell models (fr = 3.0), right panel: filled sphere models (fr = 0.03). The solid red dot-dashed line corresponds to the relation from Dopita & Evans (1986), the green dashed line to Dopita et al. (2006), and the red dotted line to a fit to Fig. 3 from Pérez-Montero (2014). The color code follows Q0 / 1. Our fit is shown with the blue line; it is obtained considering only the Q0 / 1 > 0.55 regions (see text for the corresponding values).
Current usage metrics show cumulative count of Article Views (full-text article views including HTML views, PDF and ePub downloads, according to the available data) and Abstracts Views on Vision4Press platform.
Data correspond to usage on the plateform after 2015. The current usage metrics is available 48-96 hours after online publication and is updated daily on week days.
Initial download of the metrics may take a while.