Fig. 12
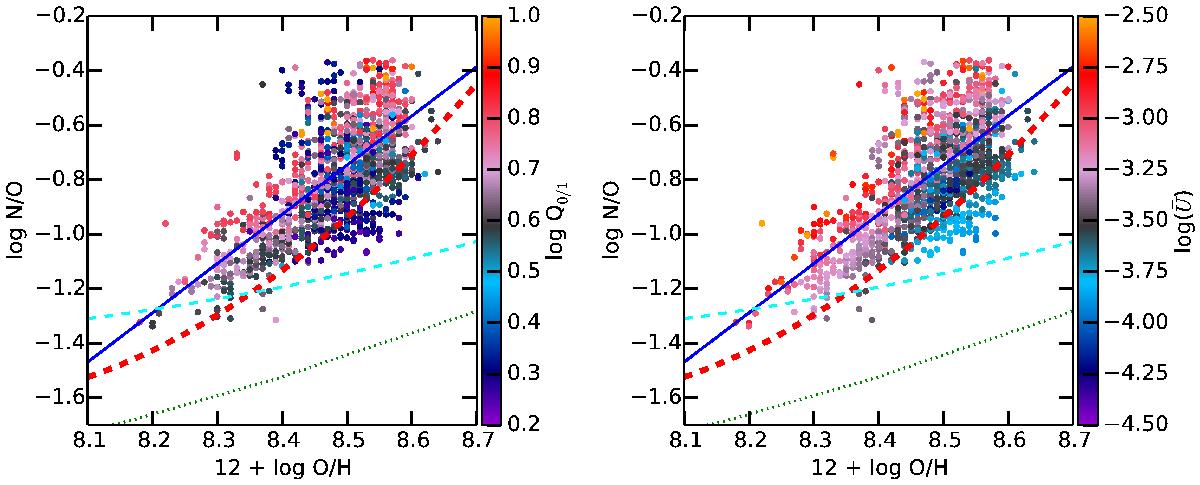
N/O vs. O/H. Left panel: the color codes the hardness of the ionizing radiation Q0 / 1. Right panel: the color codes the value of ![]() . The blue line is the fit of the Q0 / 1 > 0.55 regions (gray/red/orange points); see text for the corresponding values. The red dashed line corresponds to the fit by Pilyugin et al. (2012), the cyan dashed line to Vila Costas & Edmunds (1993), and the green dotted line to the fit by Dopita et al. (2013).
. The blue line is the fit of the Q0 / 1 > 0.55 regions (gray/red/orange points); see text for the corresponding values. The red dashed line corresponds to the fit by Pilyugin et al. (2012), the cyan dashed line to Vila Costas & Edmunds (1993), and the green dotted line to the fit by Dopita et al. (2013).
Current usage metrics show cumulative count of Article Views (full-text article views including HTML views, PDF and ePub downloads, according to the available data) and Abstracts Views on Vision4Press platform.
Data correspond to usage on the plateform after 2015. The current usage metrics is available 48-96 hours after online publication and is updated daily on week days.
Initial download of the metrics may take a while.