Fig. 11
![]() vs. [S ii]/[S iii] for the models. The colors code the hardness of the ionizing radiation. As there is no noticeable difference due to the morphology of the region, contrary to the case of [O ii]/[O iii] shown in Fig. 10, both morphologies are plotted here in the same figure. The blue line corresponds to our linear fit (taking only star forming regions into account, i.e., Q0 / 1 > 0.55; see text for the values). The red dashed line corresponds to the fit by Diaz et al. (1991).
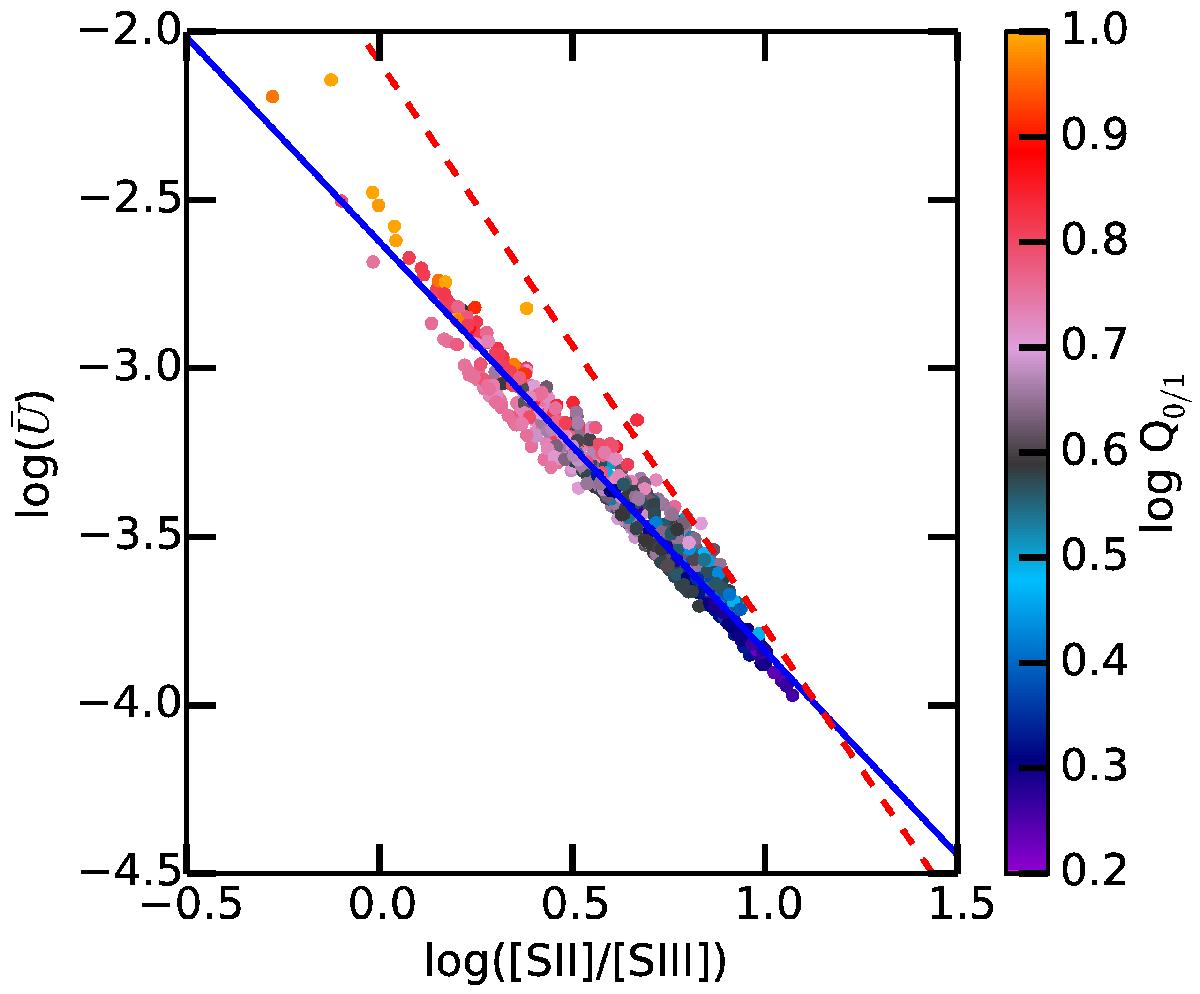
vs. [S ii]/[S iii] for the models. The colors code the hardness of the ionizing radiation. As there is no noticeable difference due to the morphology of the region, contrary to the case of [O ii]/[O iii] shown in Fig. 10, both morphologies are plotted here in the same figure. The blue line corresponds to our linear fit (taking only star forming regions into account, i.e., Q0 / 1 > 0.55; see text for the values). The red dashed line corresponds to the fit by Diaz et al. (1991).
Current usage metrics show cumulative count of Article Views (full-text article views including HTML views, PDF and ePub downloads, according to the available data) and Abstracts Views on Vision4Press platform.
Data correspond to usage on the plateform after 2015. The current usage metrics is available 48-96 hours after online publication and is updated daily on week days.
Initial download of the metrics may take a while.