Fig. 10
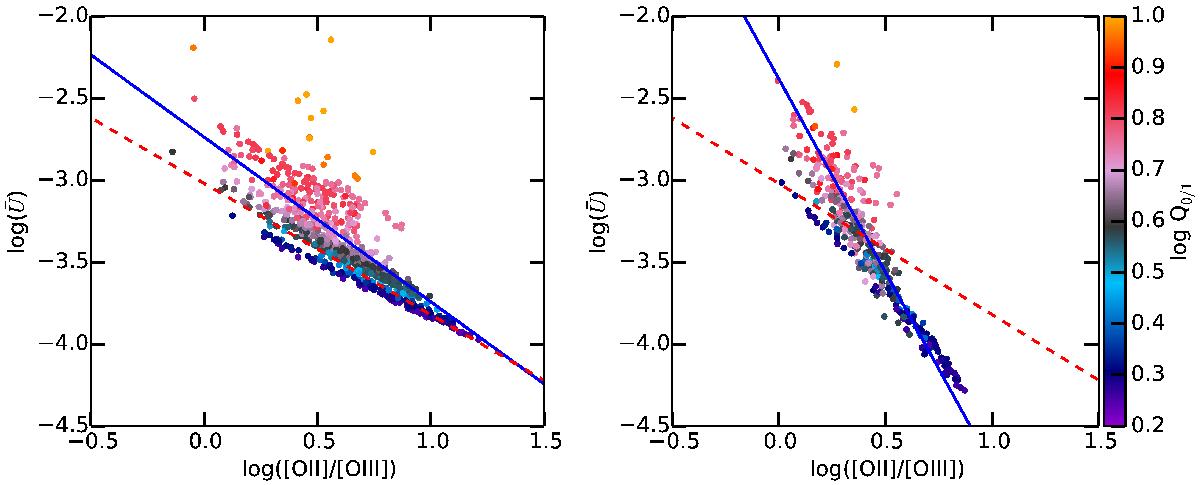
![]() vs. [O ii]/[O iii] for the models. The colors code the softness of the radiation emitted by the stellar population. Left panel: thin shell models (fr = 3.0), right panels: filled sphere models (fr = 0.03). The dashed red line is the fit by Díaz et al. (2000). The blue lines correspond to our fit (taking only star forming regions into account, i.e., Q0 / 1 > 0.55).
vs. [O ii]/[O iii] for the models. The colors code the softness of the radiation emitted by the stellar population. Left panel: thin shell models (fr = 3.0), right panels: filled sphere models (fr = 0.03). The dashed red line is the fit by Díaz et al. (2000). The blue lines correspond to our fit (taking only star forming regions into account, i.e., Q0 / 1 > 0.55).
Current usage metrics show cumulative count of Article Views (full-text article views including HTML views, PDF and ePub downloads, according to the available data) and Abstracts Views on Vision4Press platform.
Data correspond to usage on the plateform after 2015. The current usage metrics is available 48-96 hours after online publication and is updated daily on week days.
Initial download of the metrics may take a while.