Fig. 1
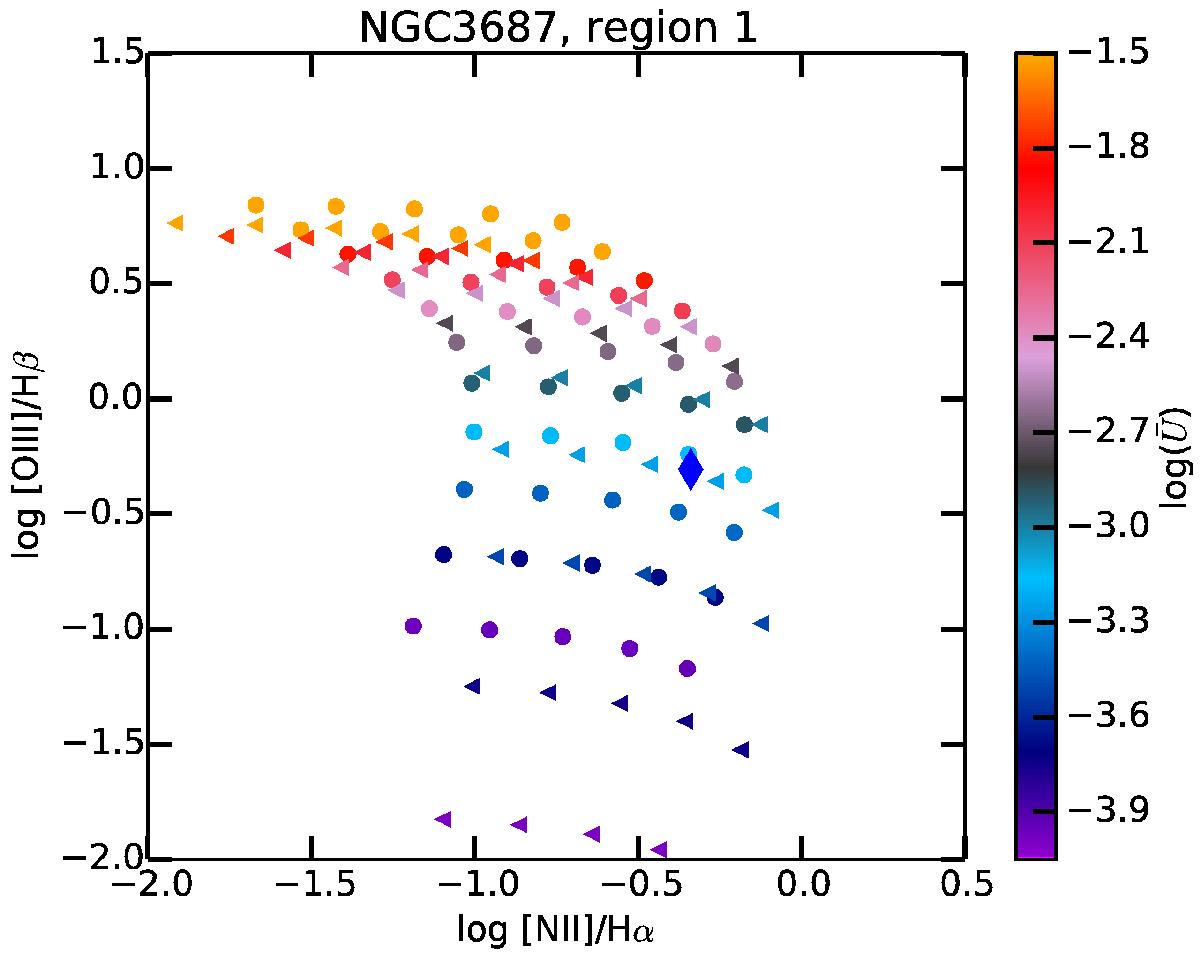
Modeled BPT diagram [O iii]/Hβ vs. [N ii]/Hα used to interpolate the values of ![]() and N/O for region 1 of NGC 3687. The blue diamond corresponds to the observed values in this [O iii]/Hβ vs. [N ii]/Hα diagram. The circles and triangles correspond to the values of the models obtained with the morphological factor fr set to 0.03 (filled sphere) and to 3.0 (thin shell), respectively. The colors correspond to the values of
and N/O for region 1 of NGC 3687. The blue diamond corresponds to the observed values in this [O iii]/Hβ vs. [N ii]/Hα diagram. The circles and triangles correspond to the values of the models obtained with the morphological factor fr set to 0.03 (filled sphere) and to 3.0 (thin shell), respectively. The colors correspond to the values of ![]() while the different values of N/O lead to models from left to right for increasing N/O.
while the different values of N/O lead to models from left to right for increasing N/O.
Current usage metrics show cumulative count of Article Views (full-text article views including HTML views, PDF and ePub downloads, according to the available data) and Abstracts Views on Vision4Press platform.
Data correspond to usage on the plateform after 2015. The current usage metrics is available 48-96 hours after online publication and is updated daily on week days.
Initial download of the metrics may take a while.