Fig. 3
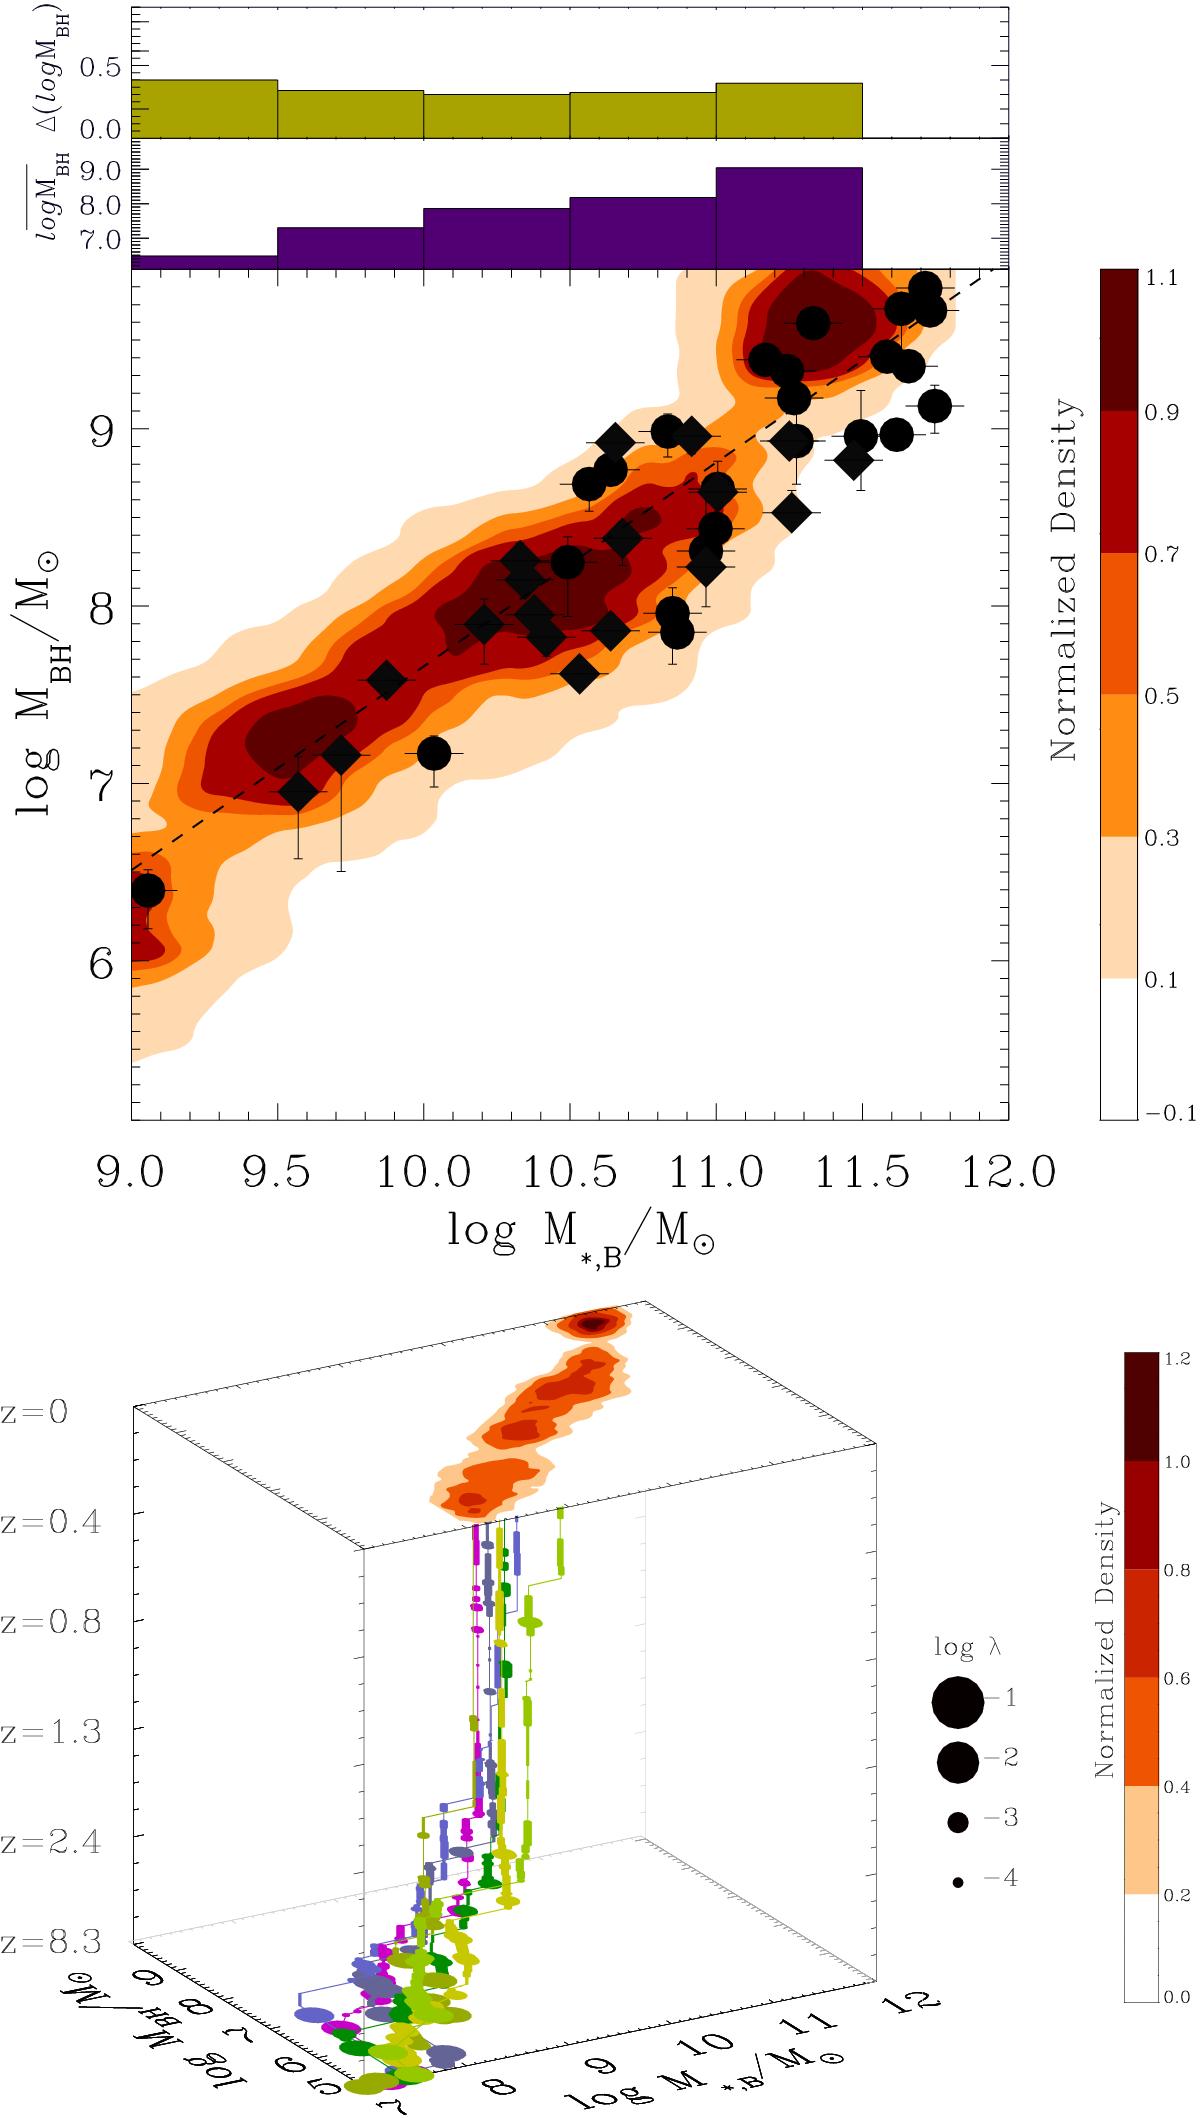
Upper panel: contour plot showing the predicted local relation MBH−M∗ ,B between the BH mass and the classical bulge mass. The contours indicate the number of galaxies in a MBH−M∗ ,B bin, normalized to the total number at fixed M∗ ,B as shown in the colour bar. We compare these values with the data reported in Kormendy & Ho (2013) for ellipticals (circles) and classical bulges (diamonds) in spiral galaxies. The dashed line in the contour plot shows the fit log MBH/M⊙ = 1.15 log (M∗ .B/M⊙)−3.84, while the histograms on the top show the average value ![]() and the scatter Δlog MBH of the distribution of log MBH/M⊙ in different bins of bulge stellar mass. Lower panel: each coloured path shows the time evolution of the BH mass MBH(t) and bulge mass M∗ B(t) contributed by all progenitors of a few selected final galaxies. The circles show the onset of an active AGN phase; their size corresponds to the Eddington ratio λ ≡ ṀBH/ṀEdd as shown in the legend.
and the scatter Δlog MBH of the distribution of log MBH/M⊙ in different bins of bulge stellar mass. Lower panel: each coloured path shows the time evolution of the BH mass MBH(t) and bulge mass M∗ B(t) contributed by all progenitors of a few selected final galaxies. The circles show the onset of an active AGN phase; their size corresponds to the Eddington ratio λ ≡ ṀBH/ṀEdd as shown in the legend.
Current usage metrics show cumulative count of Article Views (full-text article views including HTML views, PDF and ePub downloads, according to the available data) and Abstracts Views on Vision4Press platform.
Data correspond to usage on the plateform after 2015. The current usage metrics is available 48-96 hours after online publication and is updated daily on week days.
Initial download of the metrics may take a while.