Fig. 2
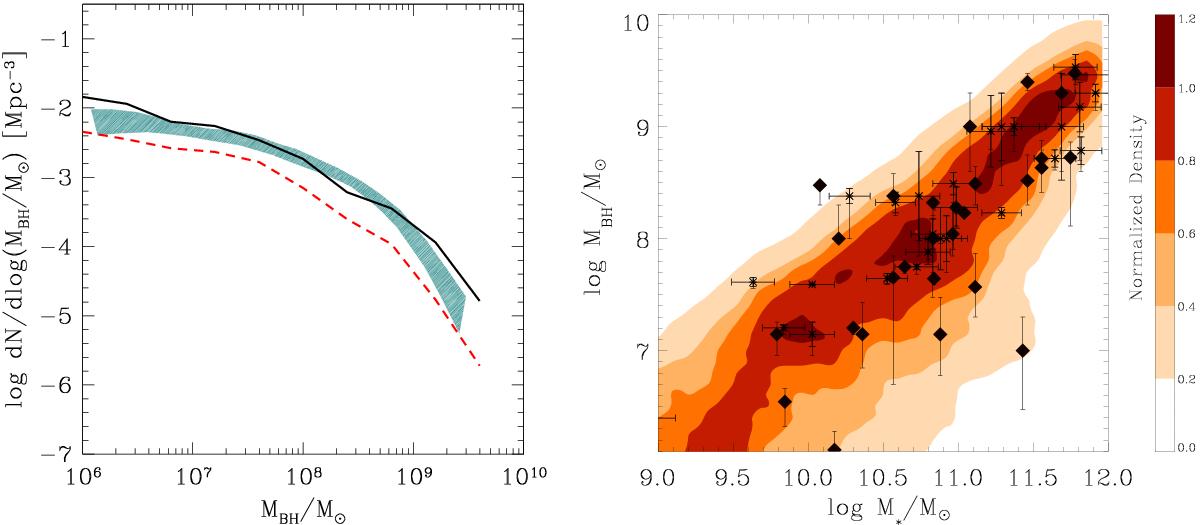
a) (Left) black hole mass function at z< 0.5 built up by interaction-driven accretion (solid line) and by BH accretion due to disc instabilities (dashed line). The shaded region defines the spread in observational estimates obtained using different methods, as compiled by Shankar et al. (2009). b) (Right) local relation between the BH mass and the total stellar content of galaxies is compared with data. Data points represent the observed local relation from Häring & Rix (2004, diamonds), and Marconi & Hunt (2003, squares; here M∗ is derived using the best-fitting virial relation of Cappellari et al. 2006); the colour code represents the fraction of objects as a function of MBH for any given value of M∗, as indicated by the bar.
Current usage metrics show cumulative count of Article Views (full-text article views including HTML views, PDF and ePub downloads, according to the available data) and Abstracts Views on Vision4Press platform.
Data correspond to usage on the plateform after 2015. The current usage metrics is available 48-96 hours after online publication and is updated daily on week days.
Initial download of the metrics may take a while.