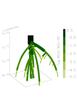
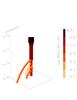
Fig. 1
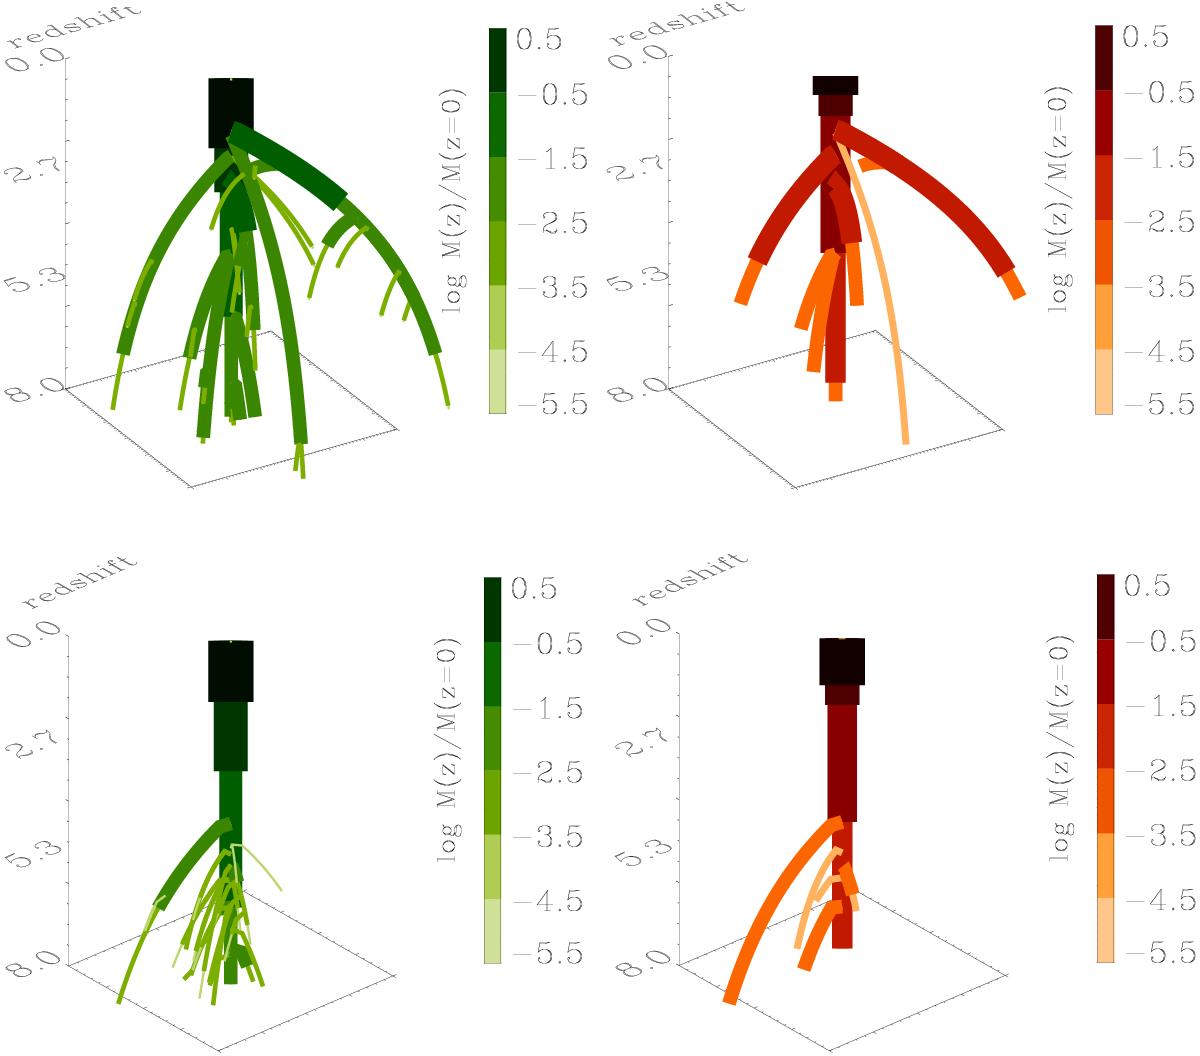
Selected merging trees. Each branch represents a progenitor of the final galaxy at the redshift indicated by the vertical axis. The spatial distribution of branches in the x-y plane is arbitrary, chosen to separate branches in order to obtain a better graphical visualization. The colour and size of each branch correspond to the stellar mass (left panels) and BH mass (right panels) associated with the progenitor galaxies. The corresponding logarithmic mass scale in units of the final mass is shown in the colourbars. To avoid overcrowding in the figure, we show only branches with masses larger than 10-5 the final value at z = 0. Thus, accretion of the small lumps containing the seed BH masses is not represented. The first history leads to a final galaxy with B/T = 0.5, the second to a final elliptical galaxy with B/T = 0.9.
Current usage metrics show cumulative count of Article Views (full-text article views including HTML views, PDF and ePub downloads, according to the available data) and Abstracts Views on Vision4Press platform.
Data correspond to usage on the plateform after 2015. The current usage metrics is available 48-96 hours after online publication and is updated daily on week days.
Initial download of the metrics may take a while.